
Figure 2.
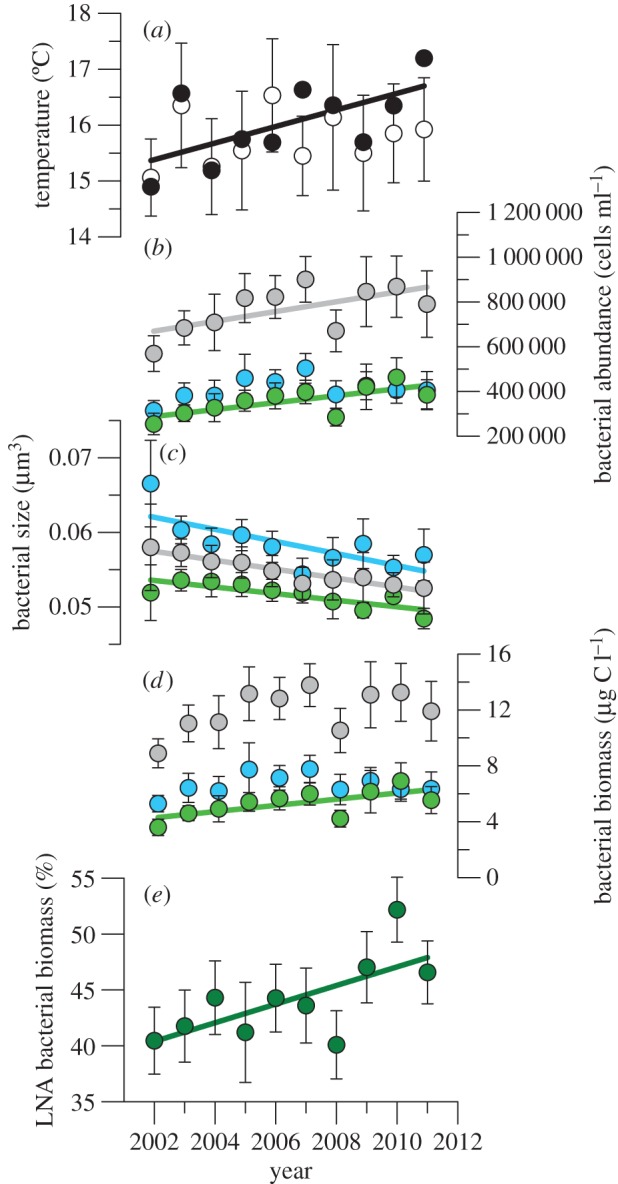
Long-term trends of temperature and bacterioplankton. Annual (April–March) mean ± s.e. values of (a) temperature, and (b–d) total, LNA and HNA (b) bacterial abundance, (c) bacterial size, (d) bacterial biomass and (e) percentage contribution of LNA bacteria to total biomass in the upper mixed layer of the study site. Filled symbols in (a) represent average temperatures for the April–July period. Error bars for this period are not shown but were on average 48% higher than the annual mean s.e. values. Fitted continuous lines represent significant trends detailed in electronic supplementary material, table S1.