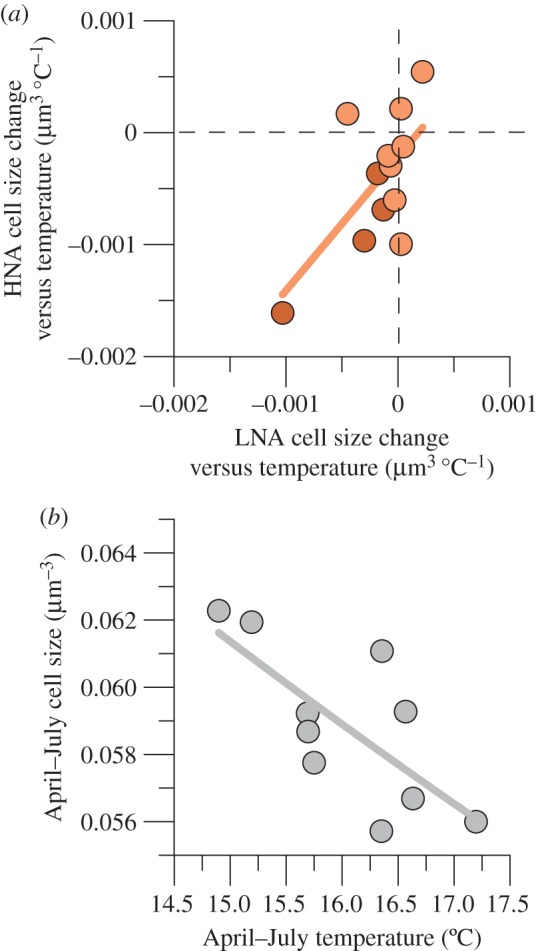
Figure 3.

(a) Comparison between cell size change versus temperature (ccc-temp) for LNA and HNA bacteria in experimental incubations with surface samples taken in 2012. Darker symbols represent results from April through July. Fitted line: HNAccc-temp = −0.0002 + 1.19 LNAccc-temp, r2 = 0.41, p = 0.024, n = 12. Dashed lines represent no change (0 slope of the linear regression, more details given in the text). (b) Relationship between mean values of bacterial cell size and temperature for the period extending from April through July of the 10 years of available data. Fitted line: April–July cell size + 0.098 − 0.024 April–July temperature, r2 = 0.52, p = 0.017, n = 10.
