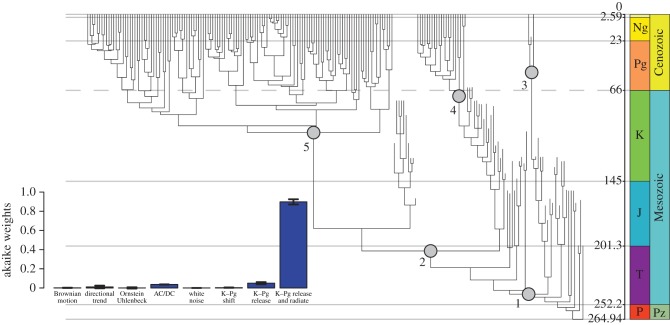
Figure 6.
The phylogeny of modern mammals, and testing for the role of the K–Pg mass extinction. The evolutionary tree shows the main clades (1, Mammalia; 2, Theria, 3, crown Monotremata; 4, crown Metatheria; 5, crown Eutheria), and the dashed grey horizontal line corresponds to the K–Pg boundary. The inset histogram shows the likelihood of different models to explain variants of the tree for living and fossil Mammalia. Based on [39]. (Online version in colour.)

