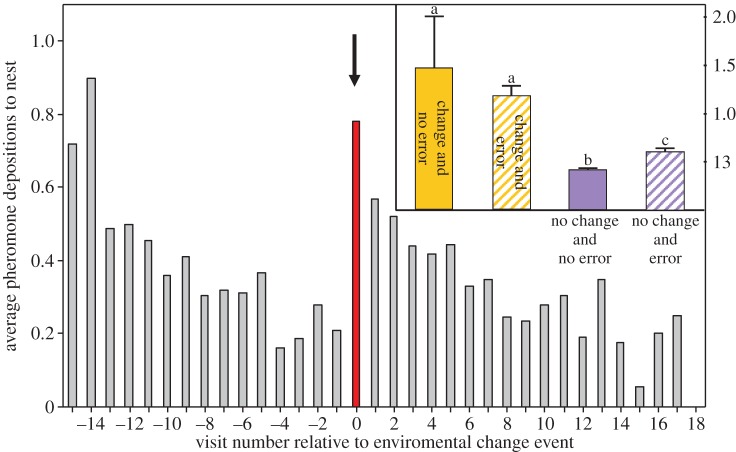
Figure 2.
Main figure: mean pheromone depositions of ants returning from the food source to the nest, by the visit number relative to the food source location change. Note that pheromone deposition is upregulated immediately after experiencing the change event. For clarity, this figure shows data only from experiments in which ants made 15 training visits to the original feeder location before the food source location was changed. See the electronic supplementary material figure S1 for similar figures from all change treatments. Inset: mean pheromone depositions of returning ants by whether or not they had experienced an environmental change event, and whether or not they had made a branch choice error before finally locating the food. This figure shows data from both ants which did and did not deposit pheromone. See the electronic supplementary material, S1 for two similar figures (figures S2 and S3) for deposition probability of ants and deposition intensity of depositing ants. Electronic supplementary material, S1 also contains all statistical results for the post hoc pairwise analyses. (Online version in colour.)

