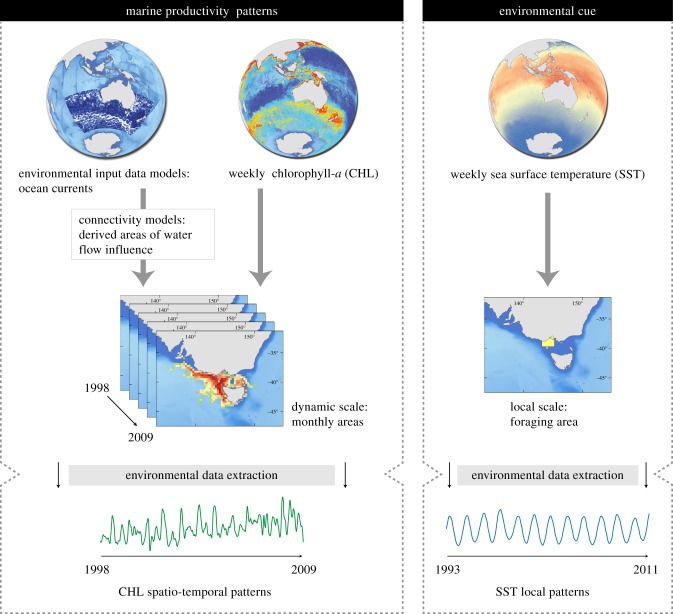
Figure 1.
Flow-chart illustrating the applied methodology. From ocean currents reanalysis model data, we derived monthly water cost movement to the Bass Strait, using water speed and direction. Areas of influence comprise waters flowing to the Bass Strait, varying monthly (see Material and methods). From this dynamic spatial scale, we then obtained mean values for CHL. Temporal patterns of SST were extracted locally from little penguins' foraging area. (Online version in colour.)

