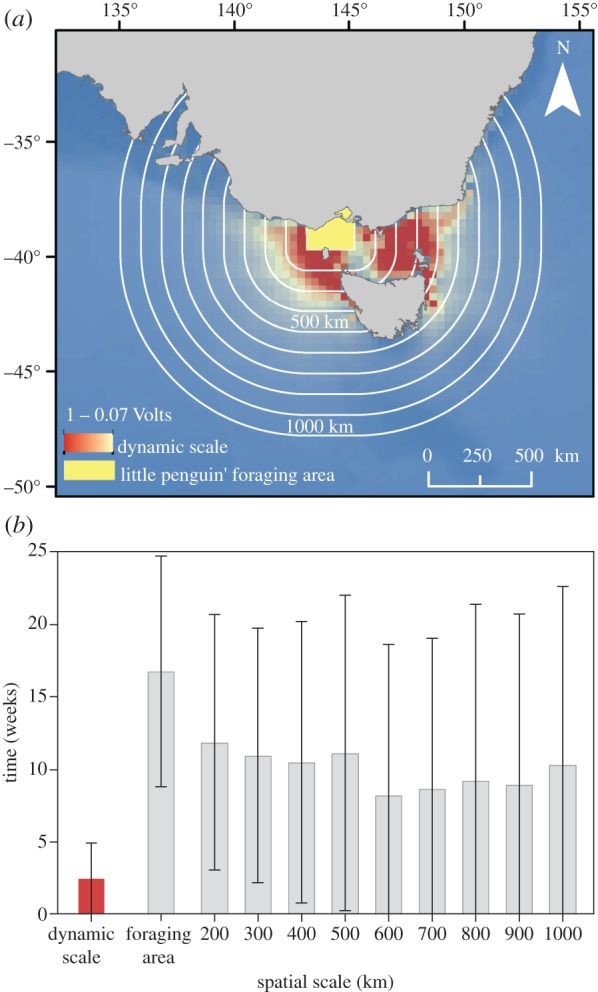
Figure 3.

Penguins phenology was closely coupled to productivity patterns at a dynamic scale. (a) Suitability of dynamic scales was compared with fixed spatial scales at incrementing intervals of 100 km from penguins foraging area delimited by Cullen et al. [15] to regional area (1000 km). Mean areas of influence for the 1993–2009 period is shown in graduated colours displaying conductivity (in volts). (b) Inter-annual variation (±s.d.) in the differences in time (weeks in absolute value) between laying date and maximum annual peak of CHL across dynamic and fixed spatial scales between 1998 and 2009. Match time is highlighted in the dynamic scale (mean: 2.42, s.d.: 2.45 weeks). (Online version in colour.)
