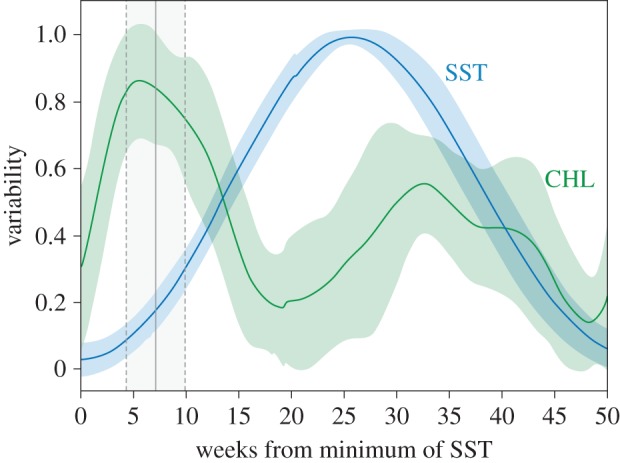
Figure 6.

Environmental cycles and little penguin reproduction. Intra-annual trend (mean ± s.d.) for environmental variables (CHL in green and SST in blue) relative to annual minimum values of SST, and subsequently daily averaged. Environmental features were transformed to a non-dimensional variable (variability) ranging from 0 to 1 and indicating the percentage of variation with respect to the intra-annual variation range. Little penguin's laying date (mean and s.d. in grey lines) occurs ca seven weeks after rising SST values and is always enclosed within the annual peak of CHL at the dynamic scale. (Online version in colour.)
