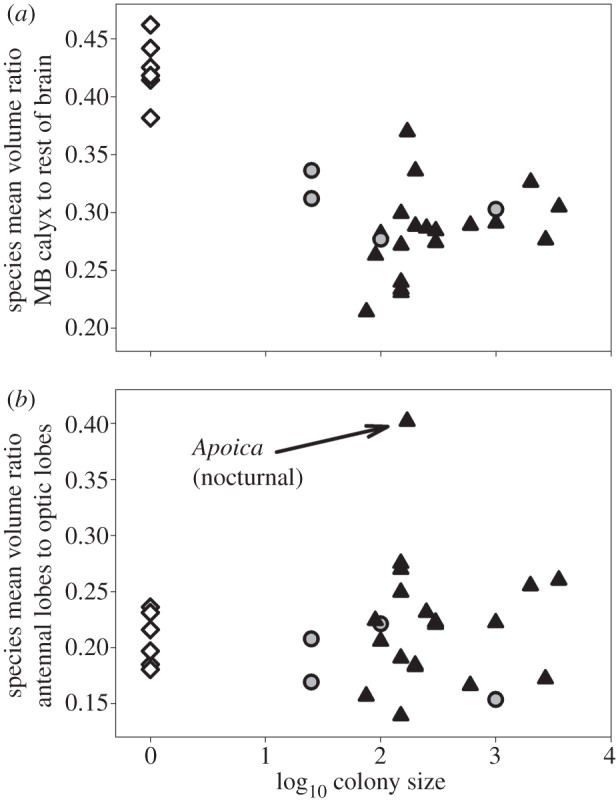
Figure 1.

Scatter plots of the relationships between mature colony size (number of adult wasps in collected nests, log10 scale) and brain structure for 29 species of vespid wasps. Diamonds, solitary species; circles, independent-founding species; triangles, swarm-founding species. (a) Relationship of colony size with investment in central processing brain tissue: MB calyx relative to brain size. (b) Relationship of colony size with investment in peripheral processing brain tissue: antennal lobe to optic lobe volume ratio. The data point for the single nocturnal species (Apoica pallens) is indicated.
