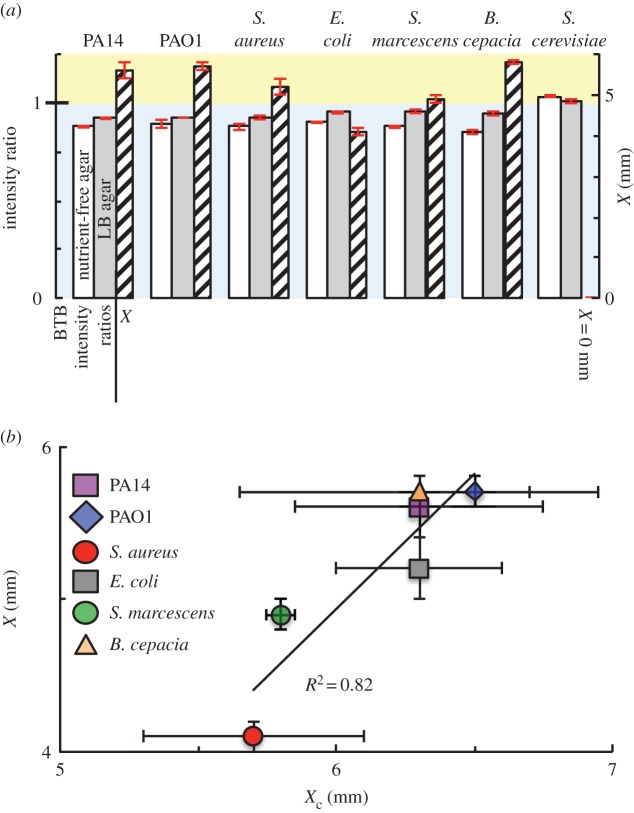
Figure 3.
Alkaline metabolic by-products from a wide range of bacterial species correlate with inhibition. (a) Different microbial strains were deposited on nutrient-free tobramycin BTB agar, on nutrient-containing LB–tobramycin BTB agar, and on antibiotic-resistant mutant lawns overlaid on LB–tobramycin agar. Images were taken immediately after deposition (for nutrient-free BTB agar), 2 h after deposition (for nutrient-containing LB BTB agar) or after overnight incubation (for antibiotic-resistant lawns on LB–tobramycin 8 μg ml−1 agar). The width of inhibition (X) is shown as hatched bars. All bacterial strains produce inhibition of antibiotic-resistant mutant lawns, however, the yeast strain fails to produce inhibition. Error bars (in red) represent standard error of the mean; n = 3. (b) For different inhibiting strains, when the width of alkaline change (Xc, see electronic supplementary material, figure S18) is plotted as a function of the width of inhibition (X), a correlation is observed (R2 = 0.82 from a linear fit, Pearson's correlation coefficient r = 0.9). Intensity profiles were used to measure the width of alkaline colour change (Xc), representing the distance from the edge of the disc to the edge of the alkaline colour change. For each replicate, Xc and X represent the average of four measurements made along two perpendicular axes. Error bars represent standard error of the mean; n = 2. (Online version in colour.)

