
Figure 2.
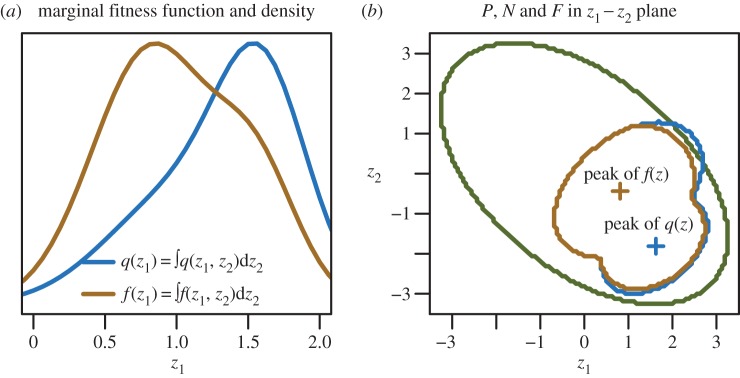
If the density of environments p(z) is far from uniform, the distribution of occupied environments in nature, f(z) may bear little resemblance to the habitat selection function q(z). This plot shows the two-dimensional habitat selection function, q(z), and joint density of occupied environments, f(z), ‘marginalized’ over variable z2 (a). Importantly, the maxima of these functions are displaced from each other by approximately half the habitable range. Nonetheless, hF(z), the boundary of the support of f(z) may be a very good approximation to hN(z), the zero net growth isocline (b). Note, particularly, that even though the maxima of p(z) and q(z) belong to different modes the supports of these functions are nearly identical.