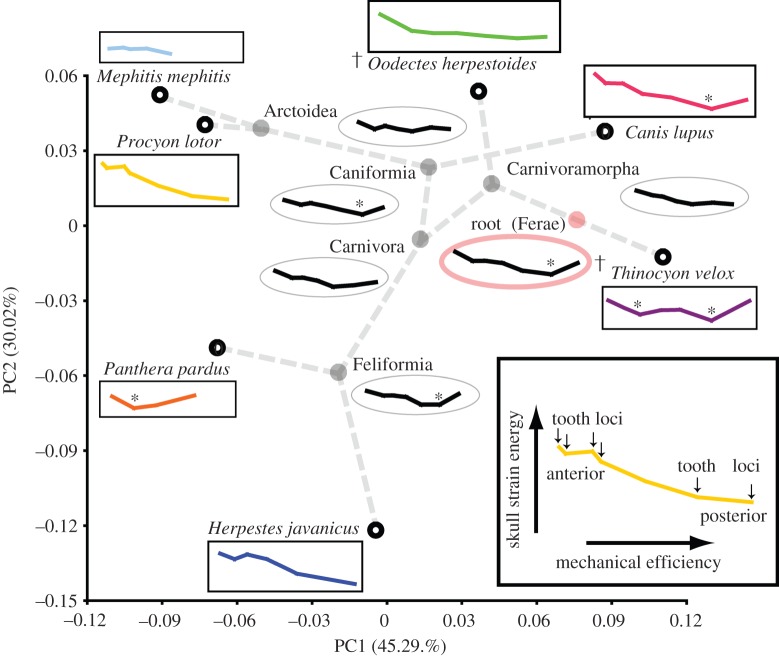
Figure 2.
Macroevolutionary changes in biting capability in a carnivore phylomorphospace. ME and skull SE curves for model simulations at terminal (rectangular boxes) and internal nodes (ovals). Profiles with inflection points associated with hypercarnivory are indicated by asterisks. Daggers indicate extinct species. Colours in the online version correspond to species data shown in the electronic supplementary material, figures S2 and S7. (Online version in colour.)

