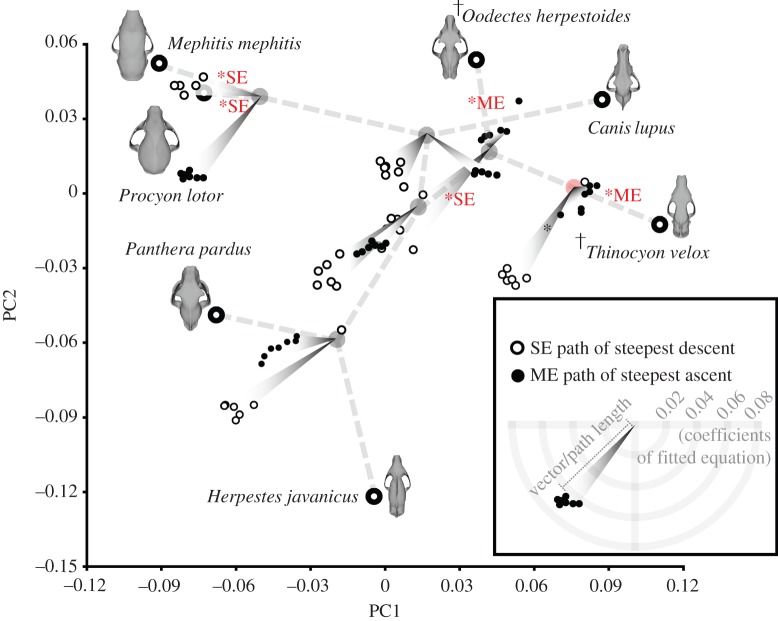
Figure 3.
Paths of steepest ascent for ME and descent for SE at each internal (ancestral) node, based on experimental results from hypothetical models using RSM. Longer path lengths indicate larger changes in attribute relative to change in PC1–PC2 values. Steepest paths of ME and SE change are shown for all tooth loci in the hypothetical models (from canine to M3). Path distances from each internal node are not in absolute units of the PC axes; they are enlarged to show trends, and only represent relative magnitudes of change and not in units of PC1–PC2 scores. Evolutionary pathways that are not statistically different from the reconstructed paths of steepest change are indicated by an asterisk, followed by the attribute that is optimized. Daggers indicate extinct species. For additional details of the RSM results, see the electronic supplementary material, figure S4. (Online version in colour.)

