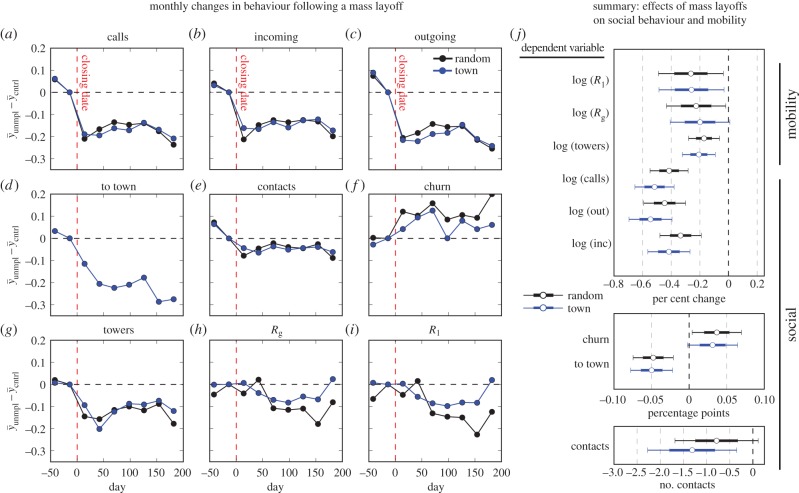
Figure 3.
Changes in social networks and mobility following layoffs. We quantify the effect of mass layoffs relative to two control groups: users making regular calls from the town, who were not identified as laid off and a random sample of users from the rest of the country. We report monthly point estimates for six social and three mobility behaviours: (a) total calls, (b) number of incoming calls, (c) number of outgoing calls, (d) fraction of calls to individuals in the town at the time of the call, (e) number of unique contacts, (f) the fraction of individuals called in the previous month who were not called in the current month (churn), (g) number of unique towers visited, (h) radius of gyration, (i) average distance from most visited tower. Pooling months pre- and post-layoff yield statistically significant changes in monthly social network and mobility metrics following a mass layoff. (j) Reports regression coefficient for each of our nine dependent variables along with the 66 and 95% CIs.

