
Fig. 3.
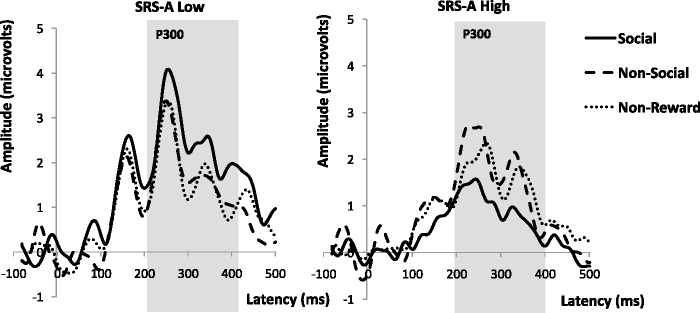
Grand mean ERP waveforms for trial hits shown separately for high and low autistic trait groups as measured by the SRS-A. (Pz electrode). Solid line social reward, Dashed line non-social reward, Dotted line non-reward. Gray bar indicates time window for statistical analysis of P3 component.