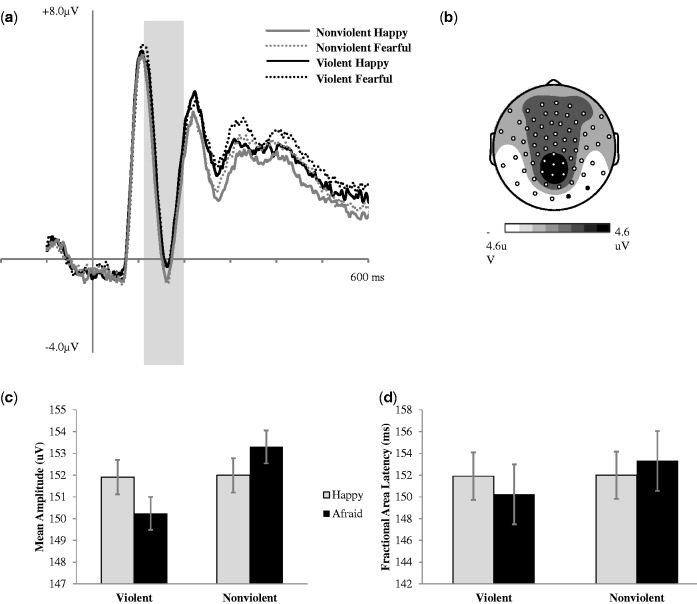
Fig. 4.
(a) Grand average ERPs (time-locked to face onset) for correct trials averaged across two right posterior electrodes indicated in black on topographic map. (b) N170 (120–200 ms post-face onset) mean amplitude scalp topography for the average of all four experimental conditions. (c) N170 mean amplitude (120–200 ms post face onset) across conditions. (d) 50% fractional area latency across conditions. Error bars represent ±1 SEM.

