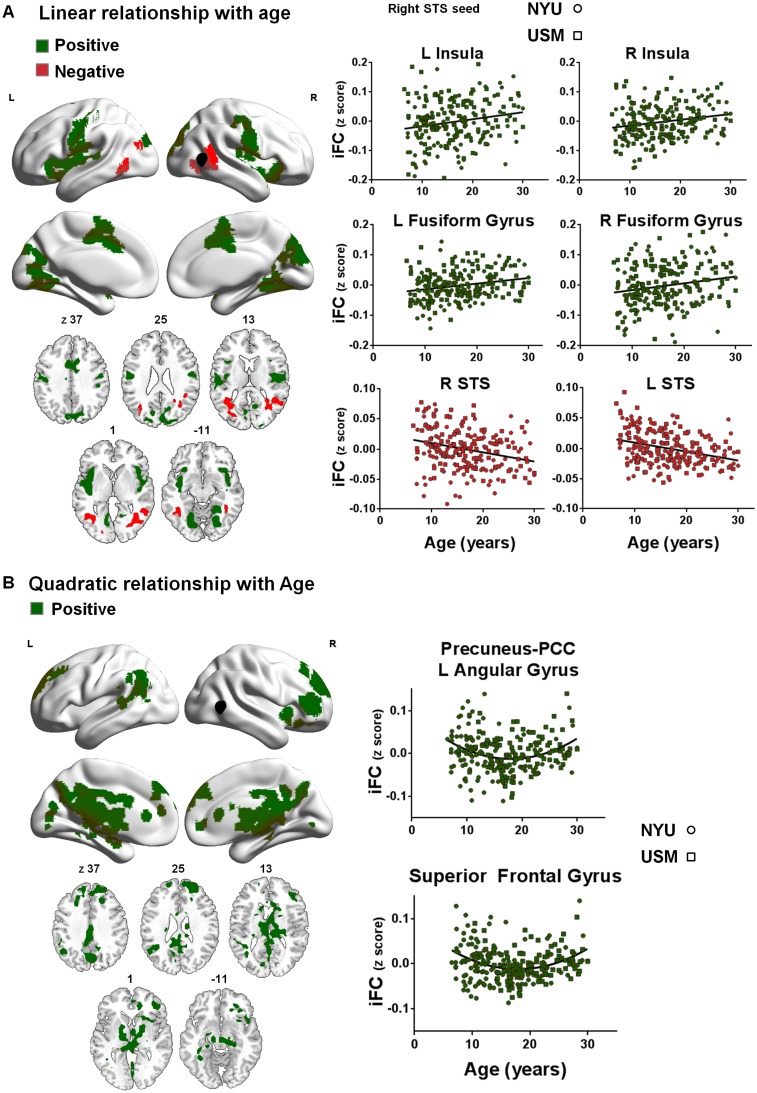
Fig. 2.
Linear (A) and quadratic (B) effects of age (7–30 years) for right pSTS iFC. Panel A depicts clusters in which iFC increased (green) or decreased (red) linearly as a function of age. Panel B depicts clusters in which iFC increased (green) quadratically as a function of age (min Z > 2.3; cluster significance: P < 0.05, corrected). The right pSTS seed is illustrated in black. The scatter plots show the positive (green) or negative (red) relationships with age across all participants (ASD and TC groups combined). NYU participants are displayed as circles; USM participants as squares. Significant clusters are overlaid on inflated surface maps generated using BrainNet Viewer (http://www.nitrc.org/projects/bnv/), as well as on axial images generated with MRIcroN (http://www.mricro.com/). L, left hemisphere; R, right hemisphere.

