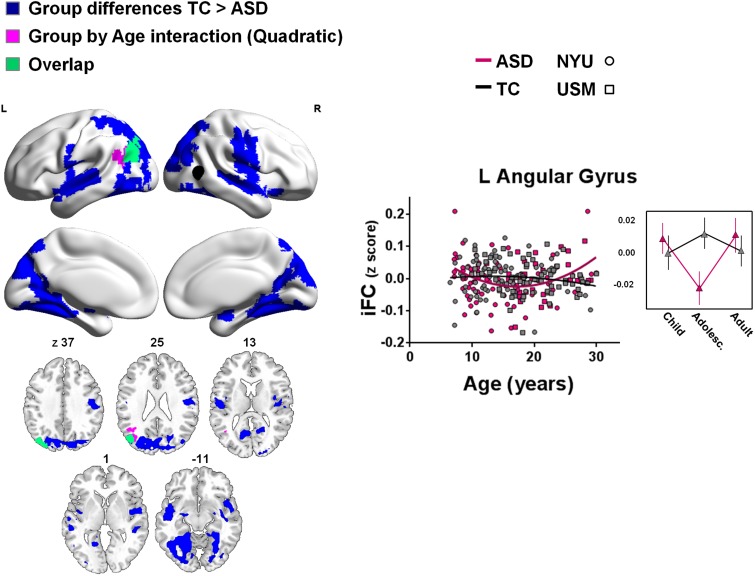
Fig. 3.
Effects of group and quadratic group-by-age interaction effects for right pSTS iFC. Shown are clusters for which group differences (TC > ASD) (blue) or group-by-age (quadratic) interaction effects (purple) were observed (min Z > 2.3; cluster significance: P < 0.05, corrected). The right pSTS seed is illustrated in black. The scatter plot and adjacent line plot show the quadratic group-by-age interaction (i.e. individual participants’ iFC-scores for the cluster shown in purple). In the line plot, age ranges are grouped for childhood: 7–12.8 years; adolescence: 12.9–18.6 years and adulthood: 18.7–30.0 years. Relationships with age are plotted separately for the ASD (pink) and TC groups (gray). NYU participants are displayed as circles; USM participants as squares. Significant clusters are overlaid on inflated surface maps generated using BrainNet Viewer (http://www.nitrc.org/projects/bnv/), as well as on axial images generated with MRIcroN (http://www.mricro.com/). L, left hemisphere; R, right hemisphere. Vertical lines in the line plots denote SEM.

