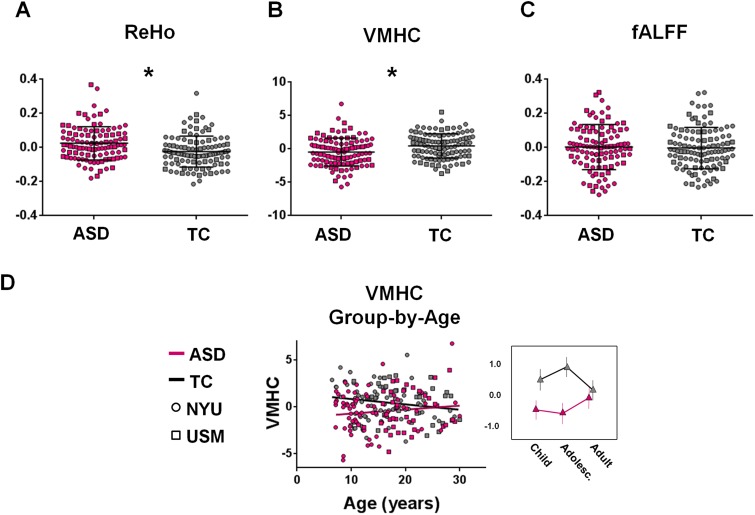
Fig. 4.
Exploration of regional measures of intrinsic brain architecture within the right pSTS. Panel A shows mean ReHo for participants with ASD (pink) and TC (gray). Participants with ASD exhibited significantly higher ‘local’ (ReHo) connectivity than the TC group. Panel B shows mean VMHC for participants with ASD (pink) and TC (gray). Participants with ASD exhibited significantly lower inter-hemispheric ‘mirrored’ (VMHC) intrinsic connectivity than the TC group. Panel C shows fALFF connectivity for participants with ASD (pink) and TC (gray). No group differences were observed in fALFF. The scatter plot and line plot in panel D show the linear group-by-age interaction obtained for VMHC, which indicates that group differences in VMHC were more pronounced at the younger ages and diminished with increasing age. In the line plot, age ranges are grouped for childhood: 7–12.8 years; adolescence: 12.9–18.6 years and adulthood: 18.7–30.0 years. VMHC is plotted as a function of age, separately for the ASD (pink) and TC groups (gray). NYU participants are displayed as circles; USM participants as squares. Vertical lines in panel A–C denote s.d. *P < 0.05 (corrected).

