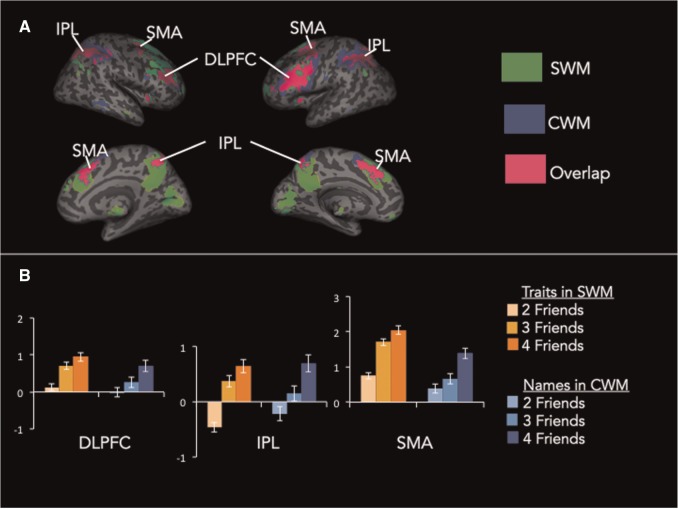
Fig. 4.
Whole-brain results from the conjunction of SWM and CWM load effects. (A) Green indicates regions associated with SWM load effects, blue indicates regions associated with CWM load effects and pink indicates regions associated with load effects for both SWM and CWM. (B) Parameter estimats of each load level plotted separately for the SWM and CWM tasks.

