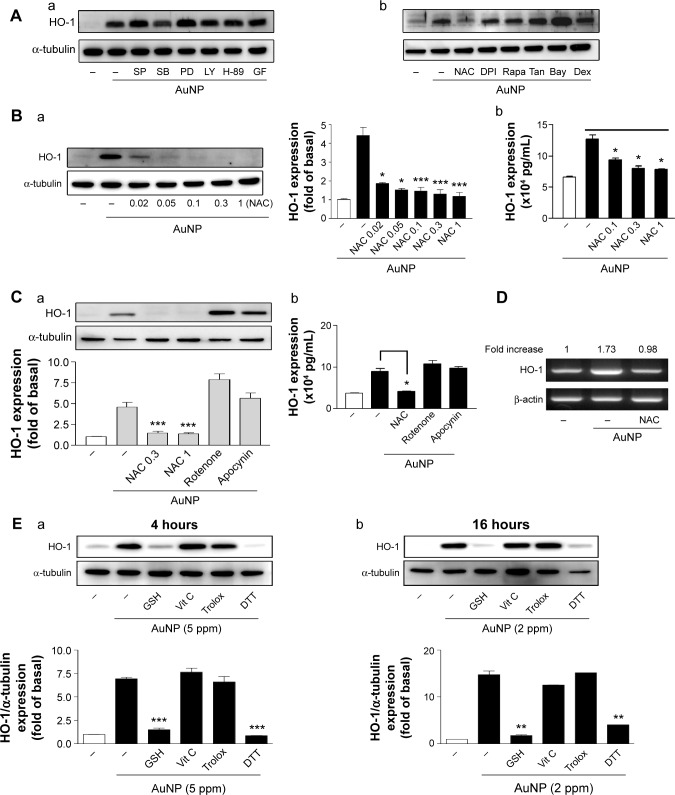
Figure 2.
Effect of signaling inhibitors on the AuNP-induced HO-1 expression.
Notes: (A) The cells were pretreated with various inhibitors for 0.5 hours, followed by AuNP treatment (2 ppm) for 16 hours. (a) SP, SB, PD, and LY: 10 μM; H-89: 5 μM; GF: 2 μM. (b) NAC: 1 mM; Rapa; DPI: 1 μM; 1 μg/mL; Tan: 10 μM; Bay: 5 μM; Dex: 100 nM. The HO-1 expression was analyzed by Western blotting. (B and C) The cells were pretreated with (B) NAC (0.02–1 mM) or (C) the indicated inhibitors, followed by AuNP treatment (2 ppm) for 16 hours. The HO-1 expression level in (B) and (C) was analyzed by (a) Western blotting and (b) ELISA. NAC: 0.3 and 1 mM; rotenone: 100 μM; apocynin: 2 μM. (D) The cells were pretreated with NAC (1 mM), followed by AuNP treatment (2 ppm) for 4 hours. The HO-1 mRNA level was analyzed by RT-PCR (n=3–5). (E) Cells were treated with AuNPs in the presence or absence of GSH (5 mM), vit C (0.5 mM), Trolox (0.1 mM), or DTT (0.5 mM) for (a) 4 or (b) 16 hours. The HO-1 expression was determined by Western blotting (n=3). *P<0.05, **P<0.01, and ***P<0.001 versus the control. The NAC values are concentrations in mM.
Abbreviations: AuNPs, gold nanoparticles; Dex, dexamethasone; DPI, diphenyleneiodonium; DTT, dithiothreitol; ELISA; enzyme-linked immunosorbent assay; GSH, glutathione; HO-1, heme oxygenase-1; NAC, N-acetylcysteine; Rapa, rapamycin; RT-PCR, reverse transcription polymerase chain reaction; Tan, tanshinone IIA; vit C, vitamin C; SP, SP600125; SB, SB202190; PD, PD098059; LY, LY294002; GF, GF1009203X.

