Figure 1.
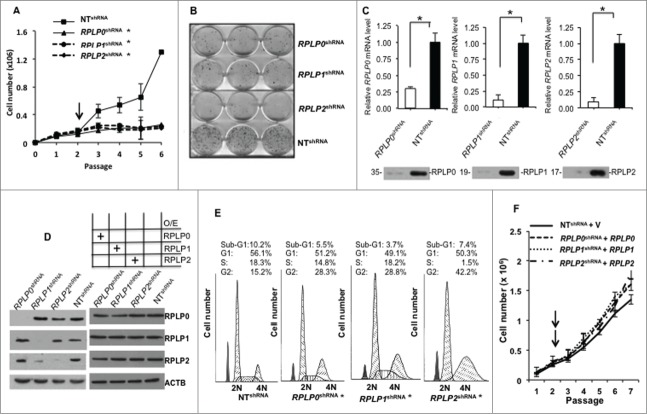
RPLP protein downregulation induces cell growth arrest. (A) Growth curves of MCF-7 cells stably expressing a control non-target shRNA vector (NT shRNA), or shRNA vectors targeting the RPLP0, RPLP1, or RPLP2 genes (RPLP0 shRNA, RPLP1 shRNA, or RPLP2 shRNA, respectively) with the 3T3 protocol.67 The black arrow represents the recovery point from the drug selection. The data presented are the mean ±SD of 3 independent experiments. *, P ≤ 0.05. (B) Colony formation assay. MCF-7 cells were stably infected with the indicated shRNA vectors (as in A), and were plated at a density of 3,000 cells/well. After 20 d, cells were fixed and stained with a crystal violet solution. Only MCF-7 cells expressing NT shRNA were able to form a high number of colonies. All experiments were performed 3 times (n = 3). (C) Relative mRNA levels of RPLP0, RPLP1, and RPLP2 in MCF-7 cells expressing NT shRNA, RPLP0 shRNA, RPLP1 shRNA, or RPLP2 shRNA vectors, related to parental MCF-7 control cells (mRNA levels set as 1). Data indicate mean values ±SD. *, P ≤ 0.05 versus NT shRNA. The bottom figures represent the corresponding expression of RPLP0, RPLP1, and RPLP2 proteins in MCF-7 cells expressing NT shRNA, RPLP0 shRNA, RPLP1 shRNA, or RPLP2 shRNA. (D) Left panel, western blot analysis of RPLP0, RPLP1, and RPLP2 expression levels in lysates of MCF-7 cells expressing RPLP0 shRNA, RPLP1 shRNA, RPLP2 shRNA, or control NT shRNA vector. ACTB was used as a loading control. Right panel represents the protein levels of RPLP0, RPLP1, and RPLP2 after their overexpression in their corresponding knock down cell lines as indicated in the figure. O/E, overexpression. (E) Cell cycle profiles of MCF-7 cells after transfection. Cells transfected with RPLP0 shRNA, RPLP1 shRNA, RPLP2 shRNA, or NT shRNA were stained with propidium iodide and the effect on cell cycle progression was monitored with FACS analysis. *, P ≤ 0.05. (F) Growth curves of MCF-7 cells stably expressing a control non-target shRNA vector (NT shRNA), or shRNA vectors targeting the RPLP0, RPLP1, or RPLP2 genes (RPLP0 shRNA, RPLP1 shRNA, or RPLP2 shRNA, respectively) plus the cDNA of RPLP0, RPLP1 and RPLP2 in each case. The black arrows represent the recovery point from the double drug selection.

