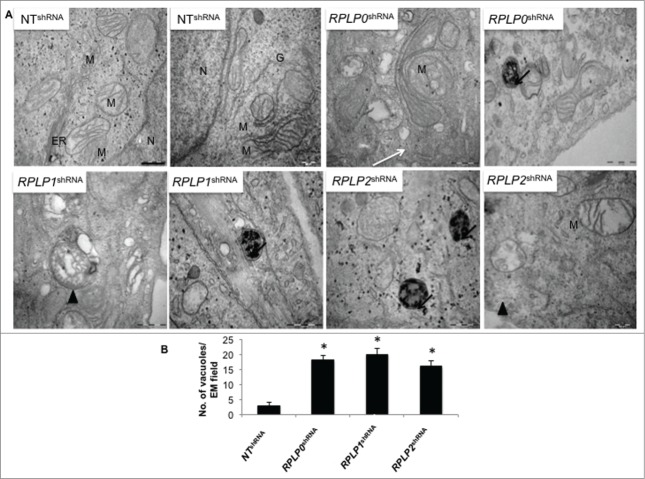
Figure 3.
Detection of autophagy by TEM. (A) MCF-7 cells were induced to express the indicated shRNAs. After selection with puromycin for 3 d, cells were fixed and examined. High power magnification at the indicated scale revealed autophagosomes (arrow heads) and autolysosomes (black arrows), features characteristic of autophagic cells. The white arrow (RPLP0 shRNA) indicates a double-membrane structure engulfing a putative defective mitochondria that resembles an incipient phagophore. N, nucleus; M, mitochondria; ER, endoplasmic reticulum; G, Golgi apparatus. Scale bar: 0.5 μm. (B) Quantifications are based on counting autophagic vacuoles in the field of view. The values are the mean ± S.D. of 3 independent experiments. *, P ≤ 0.05.

