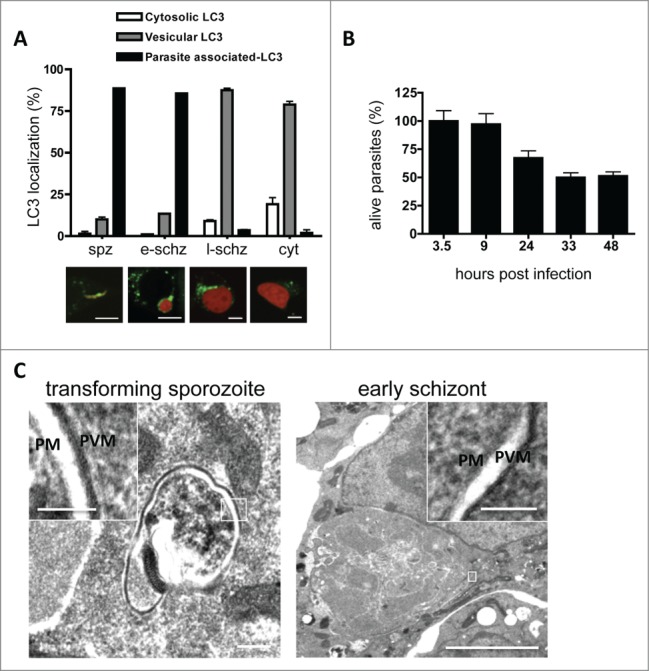
Figure 2.

In vitro LC3 dynamics in Plasmodium berghei-infected cells. (A) HepG2 cells were transfected with a plasmid encoding GFP-LC3, infected with P. berghei sporozoites expressing mCherry protein, and monitored at different phases of development. Spz: invaded sporozoites at 4 hpi; e-schz: early schizont at 24 hpi; l-schz: late schizont at 48 hpi; cyt: cytomere stage at 56 hpi. Representative images are shown below the graph. The infected host cells harboring LC3-associated parasites, vesicular LC3, or cytoplasmic LC3 were counted and expressed as percentages. Scale bars: 10 µm. (B) To study the dynamics of parasite elimination during liver-stage infection, HepG2 cells were seeded in 96-well plates and infected with mCherry-expressing parasites. To eliminate the extracellular parasites, the infected cells were treated with an anti-CSP antiserum. The parasites were then counted by using an IN Cell analyzer at the indicated time points. The average number of invaded parasites at the sporozoite stage (i.e. 3.5 hpi) was considered to be 100%. (C) Electron microscopy analysis of P. berghei-infected cells during sporozoite transformation and early schizogony. The overview and the magnifications clearly demonstrate that apart from the parasite membrane (PM) and the parasitophorous vacuole membrane (PVM), no other surrounding membranes are visible. The insets are magnifications of the areas of interest, including PM and PVM. Scale bars of the left image: 200 nm; inset: 100 nm. Scale bars of the right image: 2 µm; inset 100 nm.
