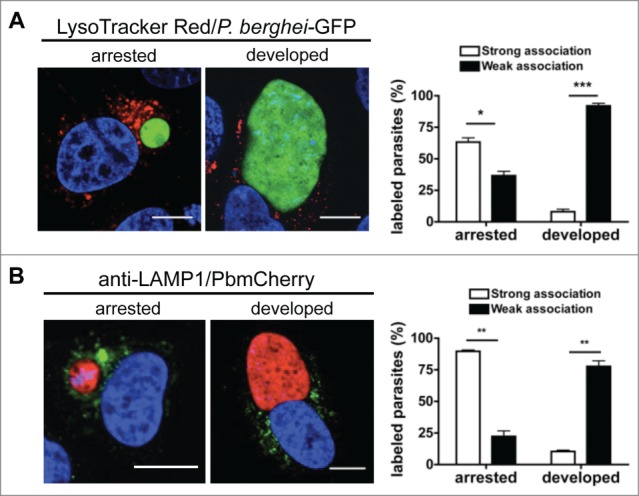
Figure 5.

Autophagic markers label arrested parasites. (A) HepG2 cells infected with fully virulent P. berghei-GFP sporozoites were labeled with LysoTracker Red for 10 min. At 48 hpi, the cells were monitored by live microscopy. LysoTracker Red-positive vesicles around the parasites were counted and scored as strong or weak associations as described in Figure 4. The strongly and weakly associated parasites were then counted and expressed as percentages. Each bar indicates the average of 3 independent experiments. Standard deviations are depicted. DNA was stained with Hoechst 33342. Scale bars: 10 µm. Arrested P = 0.0298. Developed P = 0.0011. (B) HepG2 cells infected with mCherry-P. berghei sporozoites were fixed 48 hpi and stained with an antibody specific for LAMP1 (green). DNA was stained with DAPI. Scale bars: 10 µm. The association of LAMP1-positive vesicles with the parasites was scored as strong or weak as before (Fig. 4B). The strongly and weakly associated parasites were then counted and expressed as percentages. Each bar indicates the average of 3 independent experiments. Standard deviations are depicted. P = 0.0023 (arrested), P = 0.002 (developed).
