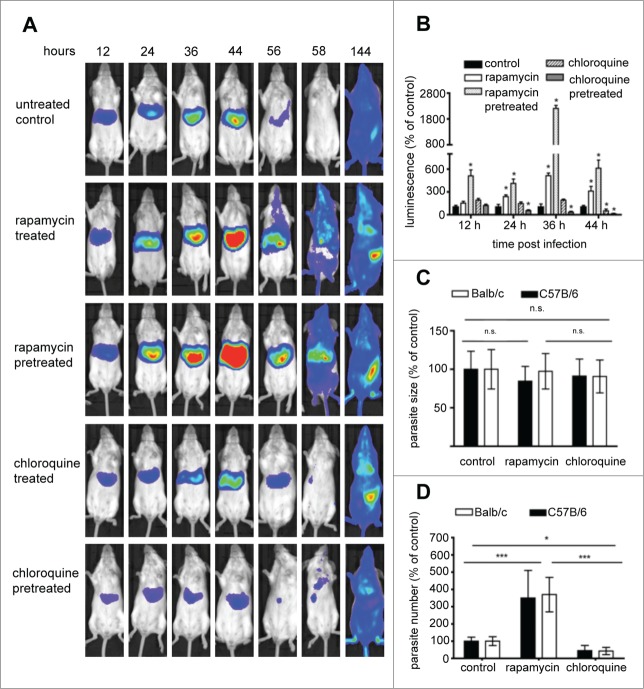
Figure 10.
Assessment of the effect of autophagy induction and inhibition on parasite liver-stage development by in vivo bioluminescence. Balb/c mice were infected by intravenous (i.v.) injection of 1 × 10⁵ PbmCherryhsp70+Luceef1α sporozoites. Mice were divided into: a control group untreated; a control group injected with solution media only; a group treated with rapamycin 12 and 24 hpi; a group pretreated with rapamycin 12 h prior to infection, and 12 hpi; a group treated with chloroquine 12 and 24 hpi; a group pretreated with chloroquine 12 h prior to infection and 12 hpi (A) parasite development was assessed by whole body luminescence at the indicated time-points (hpi) in mice. Representative images of one mouse per group are shown. (B) ROI measurements for the liver area of all mice (n = 15) were recorded as photons per sec per area (photons/s/cm2) for firefly luciferase. Balb/c and C57B/6 mice were infected with 5 × 10⁴, 1 × 10⁵, and 2 × 10⁵ sporozoites. Histology sections were obtained from infected mice under 3 conditions, namely untreated controls, rapamycin-treated mice, and chloroquine-treated mice. Livers of all mice were removed 40 hpi, paraffin-fixed, H&E-stained and analyzed. Parasite sizes (C) and numbers (D) were quantified for the 3 groups. Average number and parasite sizes of control mice were set as 100%. Parasite numbers and sizes of rapamycin- and chloroquine-treated mice are expressed as percentage of controls. Experiments were repeated in triplicate (error bars show SD; *, P = 0.05; **, P = 0.01; ***, P < 0.001; for (B) for simplification * denotes P value is significant; details of significance are shown in Fig. S9).

