
Figure 5.
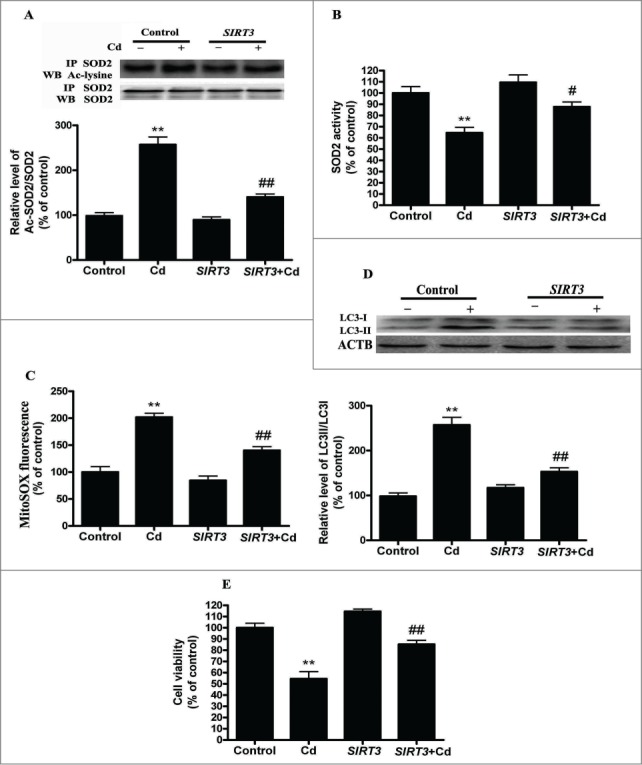
SIRT3-SOD2 modulates Cd-induced mitochondrial-derived O2•− accumulation and autophagy in cultured HepG2 cells. (A) SIRT3 overexpression induced deacetylation of SOD2 after 10 μM Cd treatment. (B) SOD2 activity in HepG2 cells. (C) Mitochondrial-derived O2•− production in HepG2 cells. (D) Representative immunoblot of LC3 protein levels in HepG2 cells. (E) Cell viability. The results are expressed as a percentage of the control, which is set at 100 %. The values are presented as the means ± SEM, **p < 0.01 versus control group, #p < 0.05, ##p < 0.01 vs. the Cd (10 μM) group. (n = 6.)