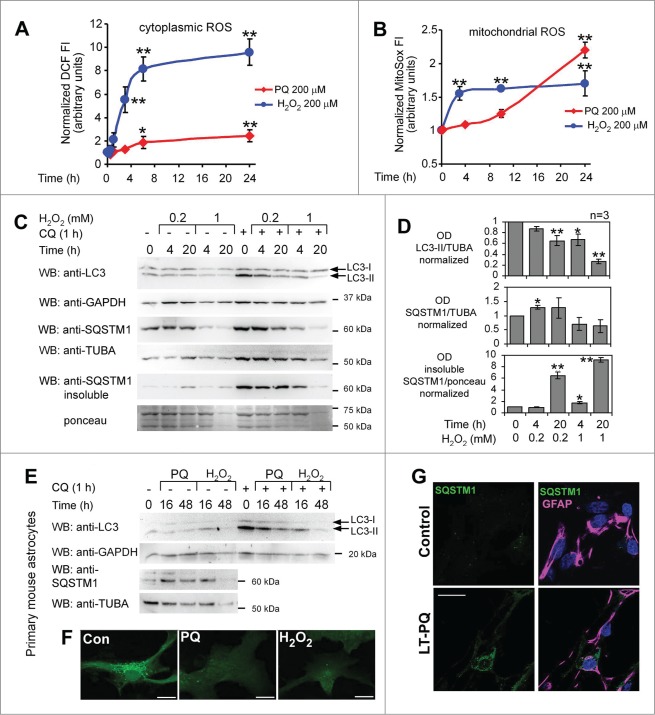
Figure 5.
Inhibition of autophagy in astroglial U373 cells and in primary astrocytes by PQ is mediated by oxidative stress. (A) ROS induction by PQ and H2O2 as detected by CA-DCF-DA in U373 cells. Live fluorescence of cell monolayers was analyzed by fluorometry 1 h after staining with CA-DCF-DA. (B) Mitochondrial ROS induction by PQ and H2O2 as detected by MitoSox staining and flow cytometry in U373 cells. Statistical analysis for (A) and (B): one-way ANOVA followed by Dunnett's post-test, n = 6 samples for each CA-DCF-DA group, 6 groups; n = 4 −5 samples for each MitoSox group, 4 groups; *P < 0.05, **P < 0.01. (C) H2O2 inhibits basal autophagy in U373 cells. The cells were treated with H2O2 (0.2 or 1 mM) for the indicated times, +/− CQ (50 μM, added 1 h before the lysis). LC3 and SQSTM1 expression was analyzed by WB after 15% and 8% SDS-PAGE, respectively. (D) Densitometric analysis of LC3-II (+CQ) and SQSTM1 bands (no CQ) from (C). Mean +/− SEM from 3 independent experiments. Statistical analysis: 2-way ANOVA followed by Bonferroni post-test, time vs concentration, n = 3 samples for each group, 5 groups for each OD analysis; *P < 0.05, **P < 0.01, compared to vehicle-treated cells. (E) Inhibition of autophagy in primary astrocytes in response to prolonged oxidative stress. Primary cultures of astrocytes isolated from mouse cortex were treated or untreated with PQ (100 μM) or H2O2 (1 mM) +/− CQ (50 μM, 3 h before lysis) and analyzed for markers of autophagy as described in (C). (F) 48 h before the treatment described in (E) the astrocytes were transfected with GFP-LC3 construct and analyzed for the presence of green dots. Representative, extended focus confocal images of GFP-LC3-expressing cells, pretreated for 3 h with CQ (50 μM), are shown. Bar: 10 μm. (G) Upregulation of SQSTM1 aggregates in primary mouse astrocytes exposed to prolonged treatment with PQ. Eight d after isolation primary cells were split and then cultured in the presence (LT-PQ) or absence (Control) of 3 μM PQ for 7 d. Primary cultures were then stained for GFAP and SQSTM1 and analyzed by confocal microscopy. Bar: 20 μM.

