Figure 9.
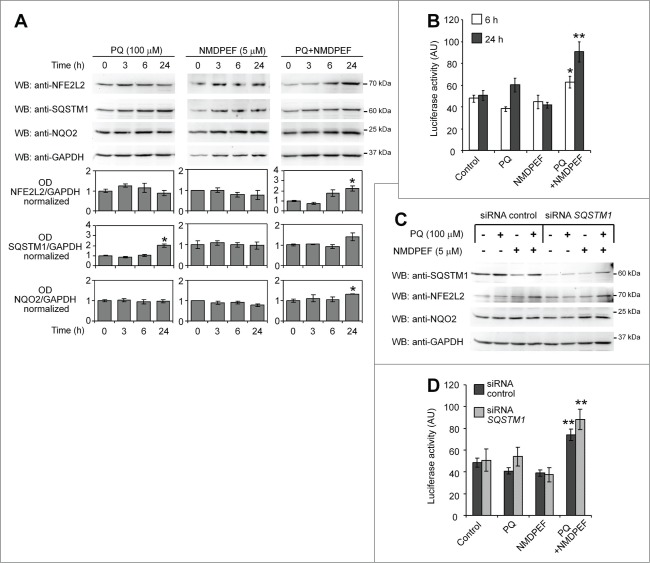
PQ and NMDPF cotreatment, but not PQ alone, stimulate NFE2L2 activity independently from SQSTM1. (A) WB analysis of NFE2L2, SQSTM1 and NQO2 protein levels treated with PQ (100 μM), NMDPEF (5 μM) or PQ (100 μM) + NMDPEF (5 μM) for the indicated times. Graphs show the OD analysis (ratio to GAPDH, normalized to vehicle-treated controls) as means +/− SEM of n = 3 blots from 3 independent experiments. Statistical analysis: one-way ANOVA followed by Dunnett post-test; 5 groups, n = 3 - 6 OD values in each group; *P < 0.05, **P < 0.01. (B) NFE2L2 activity is activated by PQ plus NMDPEF. U373 cells were transfected with ARE-Firefly and Renilla luciferase reporter plasmids and 2 days later treated with 100 μM PQ or/and 5 μM NMDPEF for 6 or 24 h. The ratio of Firefly to Renilla luciferase activity was determined twice in triplicates. The graph shows means +/− SEM of a representative experiment out of 3 independent experiments that yielded similar results. Statistical analysis: one-way ANOVA followed by Dunnett post-test; n = 6 determinations in each group, 5 groups; *P < 0.05, **P < 0.01. (C) U373 cells were transfected with a control siRNA or a SQSTM1-specific siRNA, treated as indicated and analyzed by WB for the expression of SQSTM1, NFE2L2 and NQO2. GAPDH was used as loading control. (D) U373 cells were transfected with reporter plasmids as described in (B) together with 1 μg of control siRNA or SQSTM1-targeting siRNA. The cells were then treated as indicated for 24 h and subsequently assayed for luciferase activity as described in (B). Statistical analysis: one-way ANOVA followed by Bonferroni post-test; *P < 0.05, **P < 0.01, when compared to control cells; #P < 0.05, when compared to matched group expressing control siRNA. Note that NFE2L2-dependent luciferase activity is not suppressed by SQSTM1 silencing.

