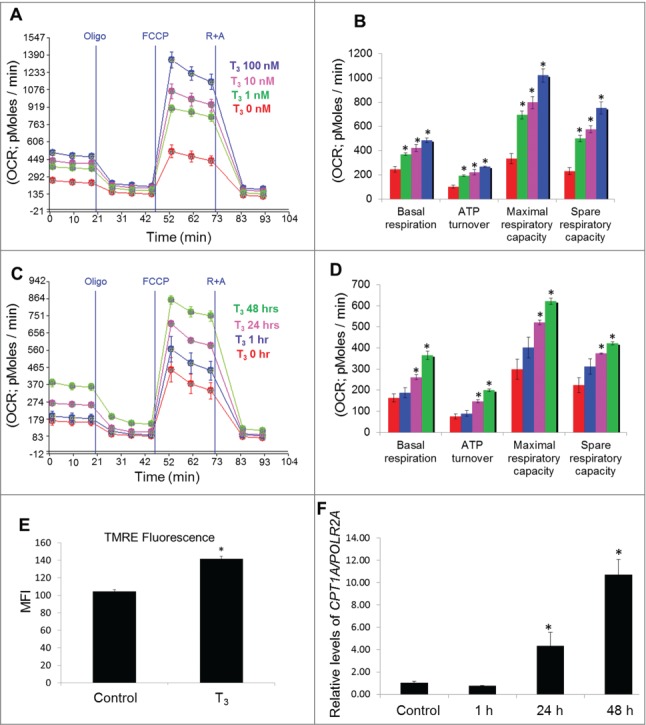
Figure 1.

T3 increases mitochondrial activity in hepatic cells. (A and B) Seahorse analysis of oxygen consumption rate (OCR) in T3-treated THRB-HepG2 cells at different dose for 48 h. (C and D) Seahorse analysis of OCR in 100 nM T3-treated THRB-HepG2 cells at variable time periods. OCR was measured continuously throughout the experimental period at baseline and in the presence of the indicated drugs. Bars represent the mean of the respective individual ratios ±SEM (n = 5). The asterisk indicates P < 0.05. (E) Mitochondrial membrane potential in T3 (100 nM/48 h)-treated THRB-HepG2 cells as assessed by TMRE (a mitochondrial membrane potential indicator) mean fluorescence intensity (MFI). (F) qPCR data showing CPT1A mRNA levels in THRB-HepG2 cells after T3 treatment (100 nM) at different time points. Values are means ±SD (n = 5). The asterisk indicates P < 0.05.
