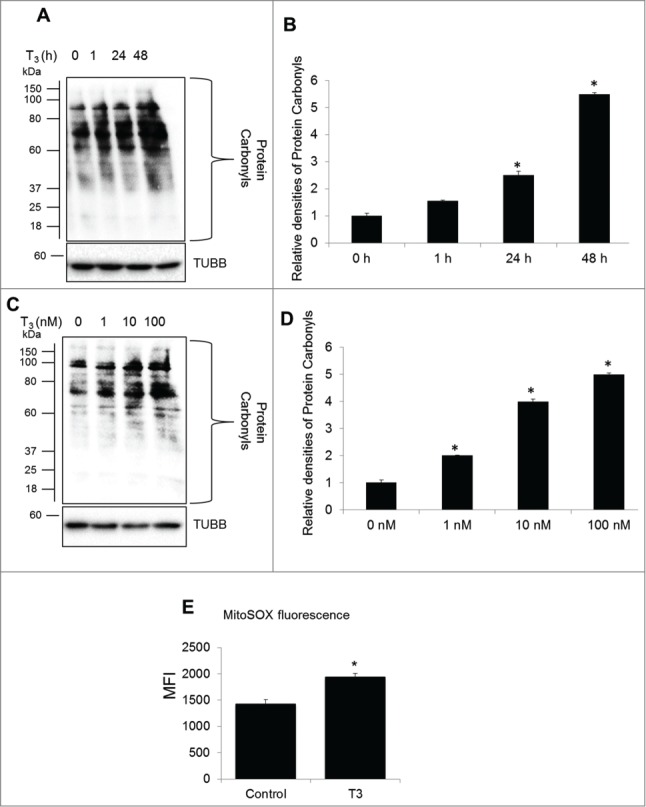
Figure 2.

T3 increases oxidative stress in hepatic cells. (A) Protein oxidation analysis using the oxyblot method in THRB-HepG2 cells at different doses of T3 for 48 h. (B) Quantification of Oxyblot assays (bars represent the mean of the respective individual ratios ±SD , n = 3,*P < 0 .05). (C) Protein oxidation analysis using the oxyblot method in THRB-HepG2 cells with 100 nM T3 for different time periods. (D) Quantification of Oxyblot assays (n = 3, *P < 0 .05). (E) Mitochondrial superoxide generation in T3 (100 nM/48 h)-treated cells measured by MitoSOX. Bars represent the mean of the respective fluorescence intensity ±SD (n = 5, *P < 0.05). TUBB, β-tubulin; MFI, mean fluorescence intensity.
