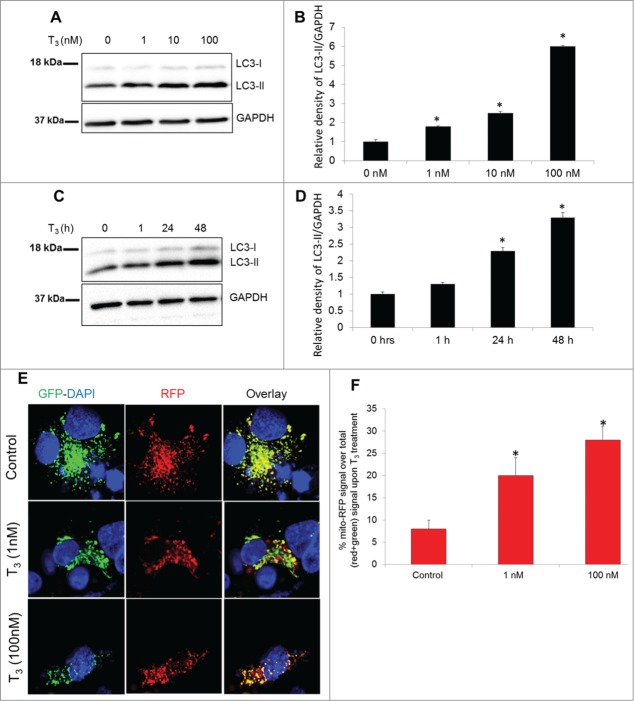
Figure 3.
T3 increases autophagy and mitophagy in hepatic cells. (A and B) Representative immunoblot and quantitation showing LC3-II levels in THRB-HepG2 cells treated with indicated doses of T3 for 48 h. Bars represent the mean of the respective individual ratios ±SD (n = 3, *P < 0 .05). (C and D) Representative Immunoblot and quantification showing LC3-II levels in THRB-HepG2 cells treated with 100 nM T3 for indicated time periods. Bars represent the mean of the respective individual ratios ±SD (n = 3, *P < 0 .05). (E) Monitoring mitophagic flux using dual fluorescence Mito-mRFP-EGFP reporter (pAT016). Lysosomal delivery of the tandem fusion protein Mito-mRFP-EGFP along with entire mitochondria results in differential quenching and degradation of the 2 individual fluorochromes, thus allowing for visual analysis of mitophagic flux. THRB-HepG2 cells transiently expressing Mito-mRFP-EGFP were treated with 1 nM or 100 nM T3 for 48 h followed by visualization using confocal microscopy (40X magnification). Nuclei were stained with DAPI (blue). In the images, fluorescence signals indicates the expression of Mito-mRFP-EGFP targeting mitochondria: yellow color, no mitophagy or normal cytosolic mitochondria; red color, mitophagy or mitochondria inside lysosomes. (F) Quantitative analysis of the RFP (red-only) fluorescence to denote % mitophagy was done. Quantification of images (at least 20 transfected cells per each sample in 3 different fields) was conducted with ImageJ software. Bars represent the mean of the respective individual ratios ±SD (*, P < 0 .05).

