Figure 5.

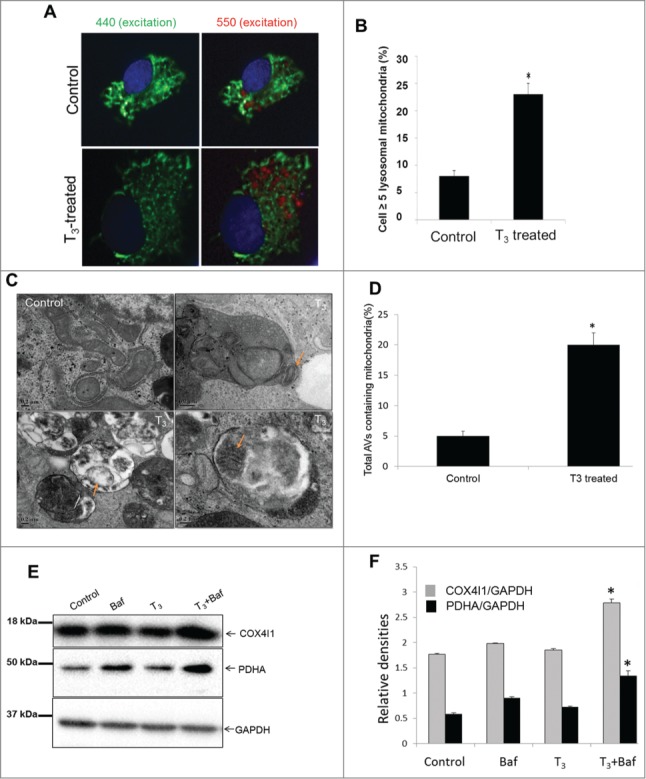
T3 increases autophagosomal delivery of mitochondria in hepatic cells. (A) pMT-mKeima-Red plasmid transfected cells were treated with +/− T3 (100 nM/48 h) followed by cell imaging (40X magnification). Nuclei appear blue. The elongated cytosolic mitochondria are at neutral pH shown as green (pseudo color) excitation wavelength of 440 nm and emission wavelength 610 nm, whereas lysosomal resident mitochondria appear as rounded shown as red (pseudo color) with excitation wavelength of 550 nm and emission wavelength 610 nm. (B) Quantitation of live cell fluorescent imaging of autophagy. Cells with ≥5 puncta preferentially excited at 550 nm relative to 440 nm were scored for at least 50 cells transfected per condition (n = 3). Asterisk indicates P < 0.05. (C) Electron micrograph of untreated control and T3 (100 nM/48 h)-treated THRB-HepG2 cells. Note the increased number of autophagic vesicle resident mitochondria (denoted with arrows) in T3-treated cells. Scale Bar = 0.2 µm. (D) Bar graphs showing % of autophagosomes (AVs) containing mitochondria in control and T3-treated THRB-HepG2 cells based on EM micrograph images. Scoring was done by counting 5 to 7 different cells in 5 random fields per condition (n=3). Asterisk indicates P < 0.05. (E, F) Representative immunoblot and densitometric analysis showing levels of mitochondrial proteins COX4I1 and PDHA in control and T3 (100 nM/48 h)-treated THRB-HepG2 whole cell lysates with or without Baf (10 nM/24 h) (SD, n = 3). Asterisk indicates P < 0.05 when compared between T3+Baf vs. Baf alone.
