Figure 6.

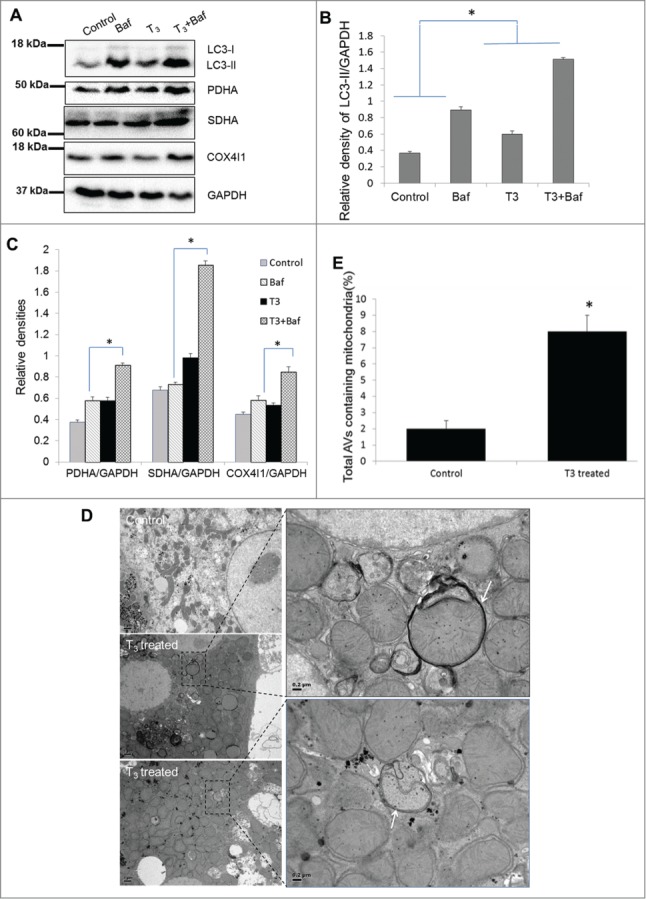
T3 increases mitophagy in primary hepatocytes. (A-C) Representative blots and densitometric analysis showing the levels of LC3-II and mitochondrial markers PDHA, SDHA, and COX4I1 with and without Baf (40 nM/8 h) in primary mouse hepatocytes treated with 100 nM T3 for 24 h (n = 3). Asterisk indicates P < 0.05 when indicated relative densities of proteins/GAPDH between T3+Baf/T3 is compared to that in Baf/control. (D) Electron micrograph of primary mouse hepatocytes treated with T3. EM of untreated control and T3-treated (100 nM/24 h) mouse hepatocytes showing increased mitophagy (denoted by arrows showing autophagosomes containing mitochondria) under T3 treatment. Scale bar =1 µm and in enlarged figures are 0.2 µm. (E) Bar graphs showing % of autophagosomes (AVs) containing mitochondria in control and T3-treated primary mouse hepatocytes based on EM micrograph images. Scoring was done by counting 10 to 15 different autophagic vesicles in 5 random fields per condition (n = 3, *p < 0.05).
