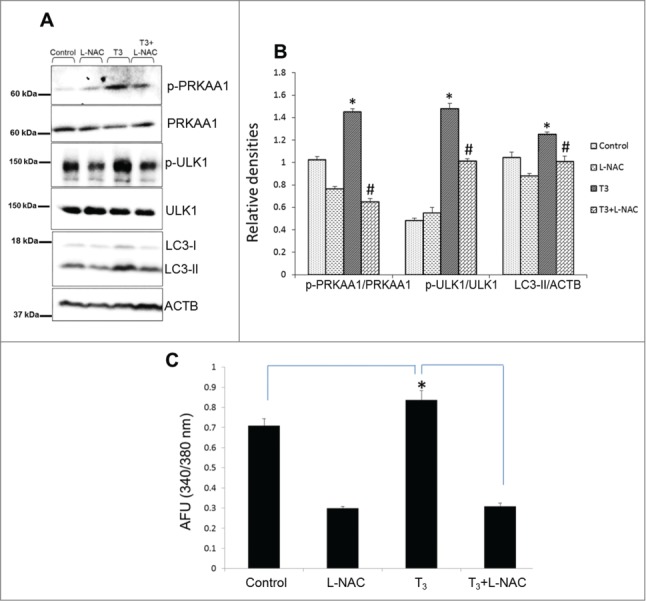
Figure 8.

T3-induced oxidative stress mediates PRKAA1/AMPK-ULK1 activation. (A and B) Representative blots showing total or phosphorylated PRKAA1/AMPK, LC3-II and ULK1 protein levels in whole cell lysates after addition of ROS inhibitor (L-NAC; 5 mM) in THRB-HepG2 treated with T3(100 nM/48 h). Bars represent the mean of the respective individual ratios ±SD (n = 3). The asterisk (* P < 0 .05) indicates a difference between T3 alone vs. control and (#P < 0 .05) indicates difference between T3+L-NAC vs. T3-alone treated cells. (C) Cells were treated with T3 (100 nM/24 h +/− LNAC (5 mM), and then loaded with Fura-2AM (1 µM). Intracellular Ca2+ was measured by fluorescence analysis. The data were presented as mean of arbitrary fluorescence units (AFU) ± SD (n = 6, *P < 0 .05).
