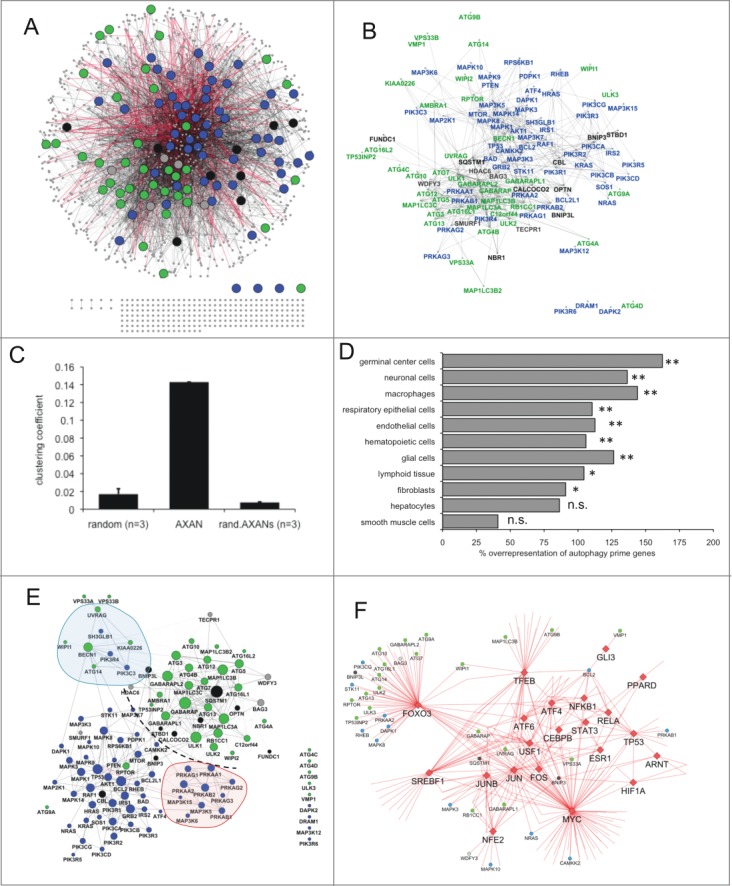
Figure 1.

Overview of AXAN and its subnetworks. (A, B) Overview of the Annotated eXpanded Autophagy Network (AXAN) displaying autophagy core (green), signaling (blue), receptors (black) and mediators (gray), as well as additional genes (small gray circles). Gray edges: protein-protein interactions (light: medium confidence; dark: high confidence); red edges: transcriptional regulation. Singleton genes and pairwise gene interactions are displayed at the bottom. For simplicity, only edges between prime genes are displayed in (B). (C) Quantitative network parameters of AXAN, randomized versions of AXAN (rand.AXANs) and 3 random human networks of similar size. (D) Cell type-specific expression of autophagy prime genes. The bar graph displays the percentage over-representation of prime genes expressed in given cell types as compared to random nonautophagy genes. *, P < 0.05; **, P < 0.01; n.s., not significant. (E) Prime gene interaction network. All AXAN prime genes and their interactions are displayed. Node size corresponds to the degree (number of neighbors). The degree distribution across this network and the layout algorithm (spring embedded layout, weighted by edge betweenness) undescores the existence of subregions: Dotted line, spatial separation between autophagy core and signaling domains; red area, protein kinase A subregion; blue, BECN1-UVRAG subregion. (F) The transcription subnetwork within AXAN. Transcription factors (red diamonds) and their target genes within AXAN are displayed. Autophagy prime genes (large circles) are marked by color-coding as described above. Non-prime target genes within AXAN are displayed as small circles.
