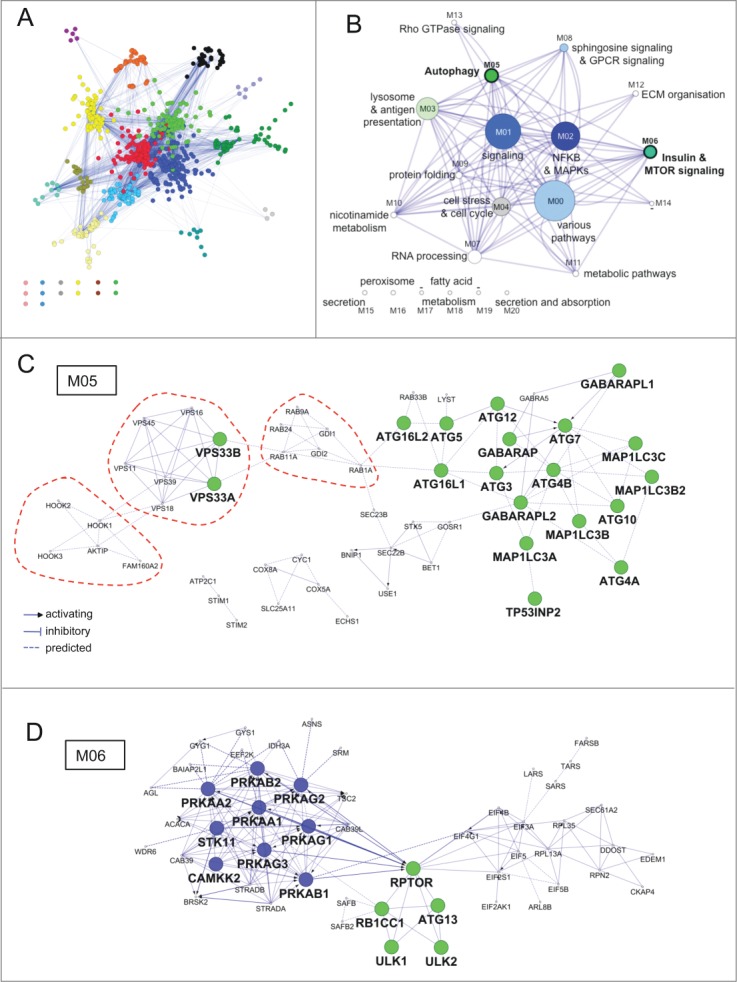
Figure 3.

Functional architecture of AXAN. (A) AXAN genes were used to construct a pathway-based functional interaction network (using Reactome database) followed by GLay community clustering for identification of modules. The 21 individual modules are displayed by different colors. (B) The modules were transformed into metanodes with node size corresponding to the number of nodes. Coloring illustrates the fraction of autophagy core (green) and/or signaling (blue) genes. Lead terms were added based on pathway enrichment analysis. The edges between metanodes correspond to interactions between the underlying genes. Modules M05 and M06 are accentuated by bold font. (C) The ‘autophagy’ module (M05). (D) The ‘Insulin & MTOR signaling’ module (M06). In both modules prime genes are displayed according to their category (green, core; blue, signaling). The red dotted lines emphasize existence of smaller functional submodules associated with specific biological functions (see main text).
