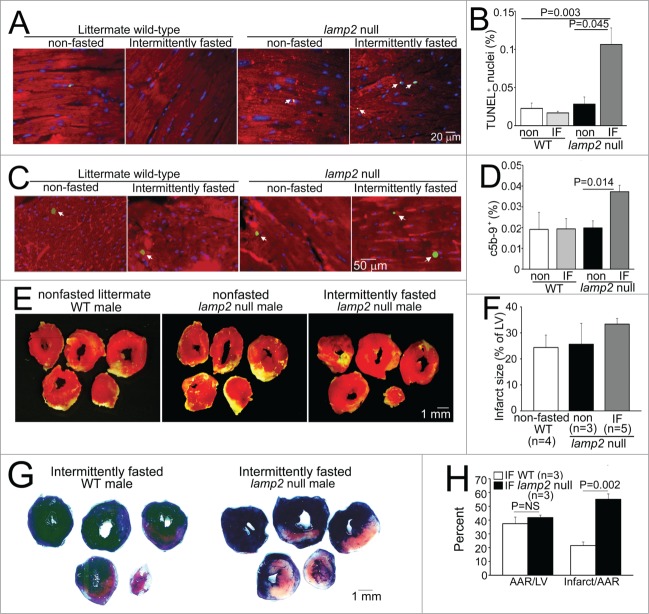
Figure 6.
Intermittent fasting provokes cardiomyocyte death in lamp2 null mice and loss of cardioprotection to ischemia-reperfusion injury. (A and B) Representative images of TUNEL-labeled cardiomyocyte nuclei (green, arrowheads; A) with quantification of TUNEL-positive nuclei (blue, DAPI) as percent of total (B; N = 3 to 5 mice/group) in lamp2 null mice or littermate controls subjected to 5 wk of intermittent fasting (IF) or provided ad libitum access to standard chow. ACTA1 staining (red) was employed to delineate cardiomyocytes. P value is by post-hoc analysis after one-way ANOVA. (C and D) Representative images of c5b-9-labeled cardiomyocyte nuclei (green, arrowheads; C) with quantification of C5-C9-positive nuclei (blue, DAPI) as percent of total (D; N = 3 or 4 mice/group) in mice treated as in (A). ACTA1 staining (red) was employed to delineate cardiomyocytes. P value is by post-hoc analysis after one-way ANOVA. (E and F) Representative images of TTC-stained sections of hearts (E) and infarct size (at 24 h; F) after in-vivo LAD territory ischemia (30 min) followed by reperfusion, in lamp2 null mice subjected to intermittent fasting for 5 wk (with surgical modeling on a fed day), nonfasted lamp2 null mice and littermate controls. (G and H) Representative images of TTC and Evans blue-stained sections of hearts subjected to ischemia-reperfusion injury (G) on a fed day after 5 wk of intermittent fasting in lamp2 null mice or wild-type controls, with quantification of area-at-risk and infarct size (H). P value is by t test. LV, left ventricle.

