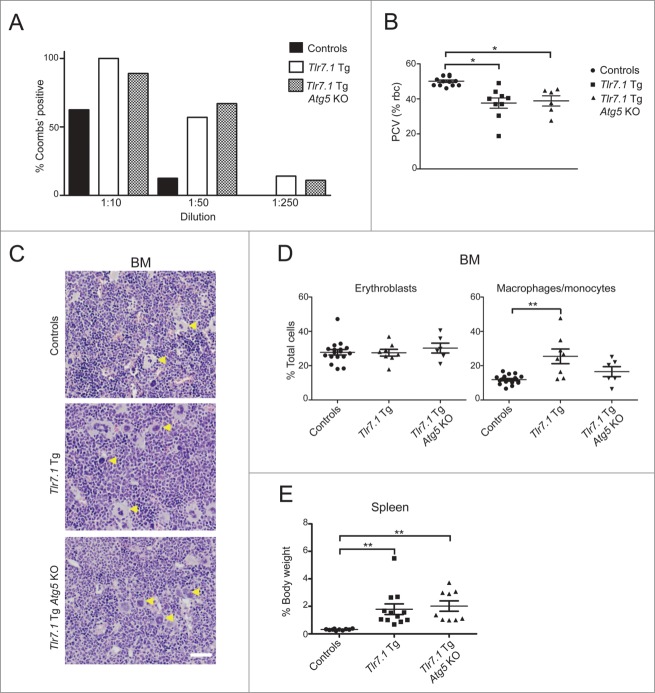
Figure 7.
Tlr7.1 Tg Atg5 KO mice present with anemia, but compensate through development of EMH. (A) Indirect Coomb's assay for IgM; the presence or absence of agglutination was determined. (B) RBC percentages shown by PCV (packed cell volume). (C) Representative H&E images of megakaryocytes in the BM of control (top panel), Tlr7.1 Tg (center panel) and Tlr7.1 Tg Atg5 KO mice (bottom panel), all 3–5 mo old. White bar: 100 µm. (D) Flow cytometry showing percentages of BM erythroid lineage cells (LY76+ ITGAM-) and macrophages/monocytes (ITGAM+ ITGAX- LY6Glow/−). (E) Spleens were weighed and normalized as a percentage of body weight. Each point is representative of an individual animal. Results are based on at least 6 mice per group. *, p < 0.05; **, p < 0.01; ***, p < 0.005, Kruskal-Wallis test with Dunn's post-test.

