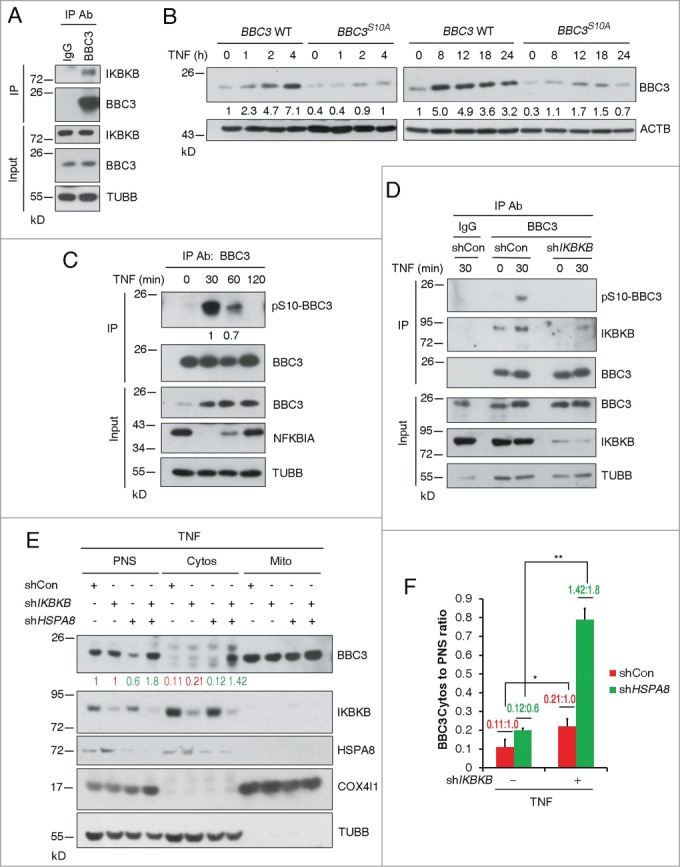
Figure 4.

IKBKB-dependent phosphorylation of BBC3 at Ser10 enables maximum BBC3 induction upon TNF exposure. (A) Representative immunoblots of immunoprecipitation (of n = 3) using IgG or anti-BBC3 antibody showing that endogenous IKBKB associates with BBC3. (B) Representative Western blots (of n = 3) of BBC3 WT and BBC3S10A HCT116 cells incubated with 10 ng/ml TNF for the indicated times showing that serine to alanine mutation results in compromised BBC3 accumulation upon TNF exposure. The ratio of BBC3 protein normalized to ACTB relative to control (marked as 1.0) is indicated below each lane. (C) Representative immunoblots with densitometric quantification following immunoprecipitation (of n = 4) using anti-BBC3 antibody in HCT116 cells treated with TNF for 30 min following control or IKBKB shRNA lentivirus infection showing BBC3 Ser10 phosphorylation upon TNF treatment. Of note, BBC3 levels in the IP experiment do not change in this case in the TNF lane, owing to saturation of the anti-BBC3 antibody. The pSer10-BBC3 protein levels were quantified relative to BBC3 protein levels in the IP experiment. (D) Representative western blots of immunoprecipitation (of n = 3) in HCT116 cells showing that BBC3 Ser10 phosphorylation upon TNF treatment is IKBKB dependent. HCT116 cells were infected with vectors containing control or IKBKB shRNA first. At 24-h postinfection, cells were incubated with TNF for the indicated times and then harvested for IP experiment. Of note, BBC3 levels in the coIP experiment do not change in this case in the TNF and IKBKB shRNA lanes, owing to saturation of the anti-BBC3 antibody. (E) Representative Western blots of mitochondria fractionation (of n = 3) in HCT116 cells showing that depletion of IKBKB results in an increase of cytosolic BBC3 upon TNF treatment. HCT116 cells were coinfected with shIKBKB and shHSPA8 lentivirus first. At 48-h postinfection, cells were treated with TNF for 30 min and then harvested. (F) The ratio of BBC3 protein normalized to TUBB (for Cytosolic fraction) in (E) relative to control (red for shCon and green for shHSPA8) is indicated. Statistics are depicted as mean ±SEM; P < 0.05 *, and 0.01**, n = 4, t test.
