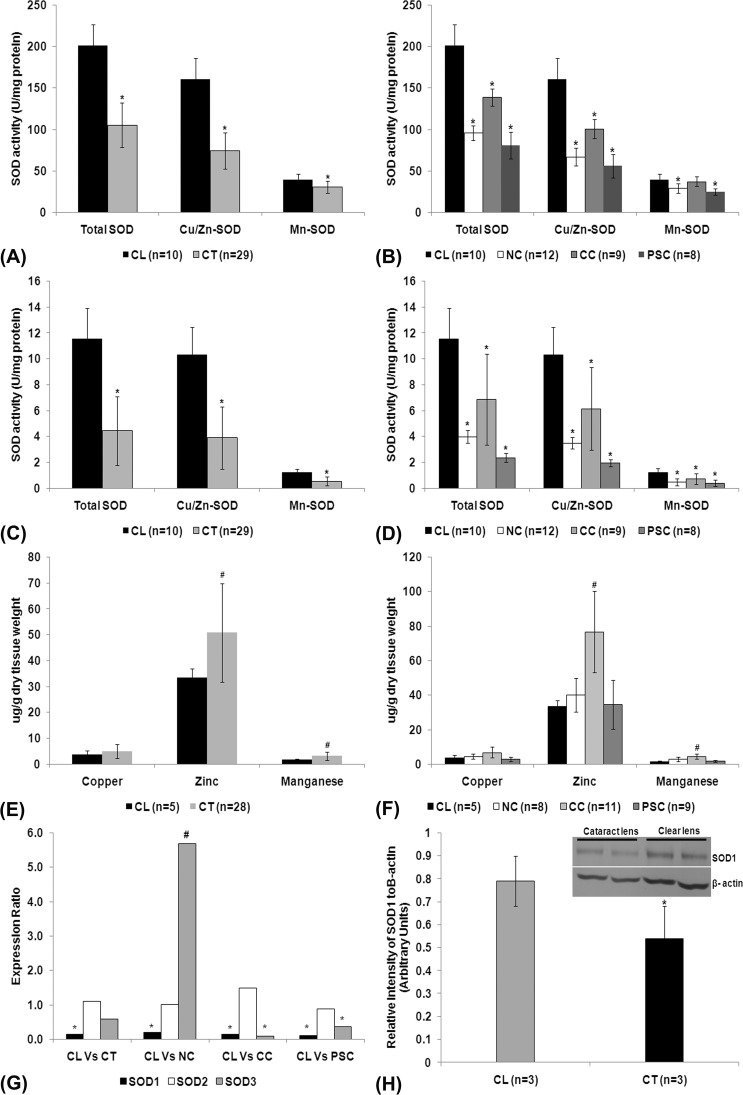
Figure 1.
SOD activity in lens epithelium (A), lens nucleus (C), and lens epithelium and lens nucleus of different types of cataract (B, D). Values are expressed as mean ± SD; * indicates significant decrease in the level of activity (P < 0.05). Estimation of cofactors in lenses (E) and in different types of cataracts (F); values were expressed as mean ± SD; # indicates a significant increase in the level of cofactors (P < 0.05). (G) Real-time quantitative PCR analysis of SOD isoform transcripts in clear (n = 12) and cataractous (n = 54) lenses and also in different types of cataracts. Values were expressed as means expression ratio. * indicates significant downregulation (P < 0.05) and # indicates significant upregulation (P < 0.05). (H) Western blot (inlet) and densitometric analysis of SOD1 protein levels in lenses. Relative band intensity analysis revealed a significant decrease in the level of SOD1 protein (*P < 0.05) in the cataractous lenses. CL, clear lens; CT, cataract lens; NC, nuclear cataract; CC, cortical cataract; PSC, posterior subcapsular cataract; Vs, versus.

