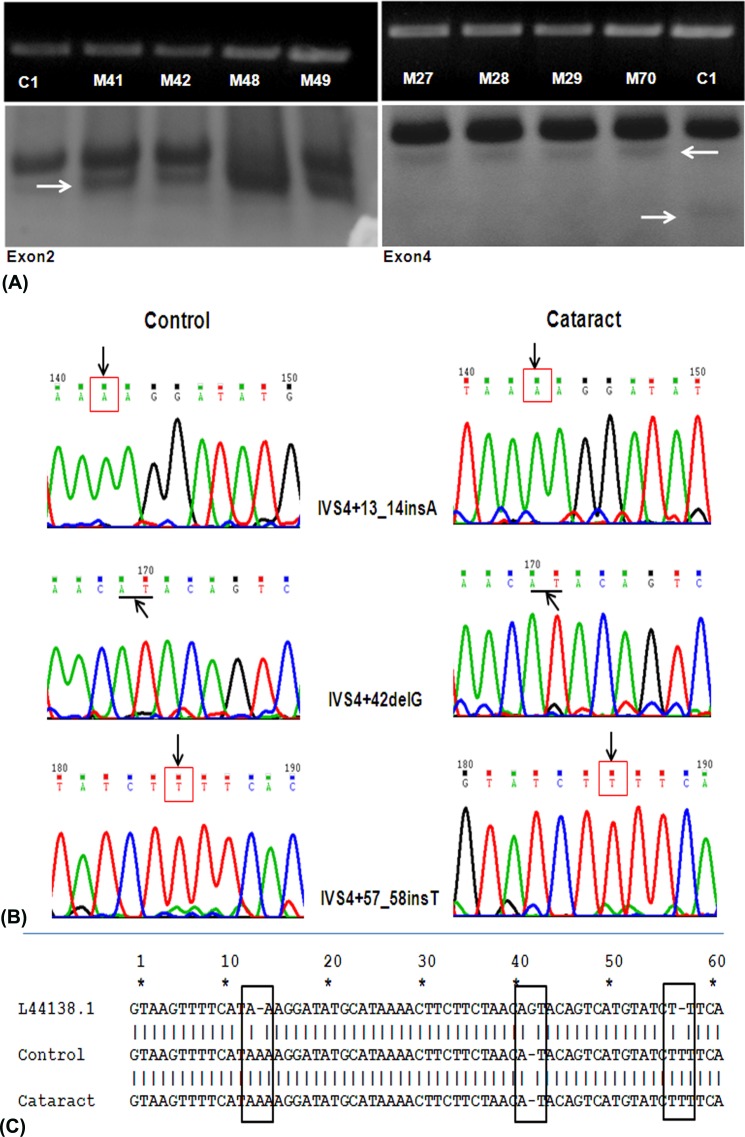
Figure 2.
(A) Polymerase chain reaction amplicons of exon2 and exon4 of SOD1 gene resolved in a 2% agarose gel (upper panel) and SSCP analysis (lower panel). C, control samples; M, cataract samples; arrows indicate mobility shifts. (B) Sequence chromatogram of exon4 of SOD1 gene from control and cataractous LE DNA samples. Arrows point to the site of nucleotide variation (insertion variations are indicated by boxes and deletion variations are indicated by underline). (C) BLAST analysis of exon4 of controls and cataractous samples against the GenBank sequence (L44318). Numbers denote the intronic nucleotide position; boxes represent the site of the nucleotide polymorphisms.

