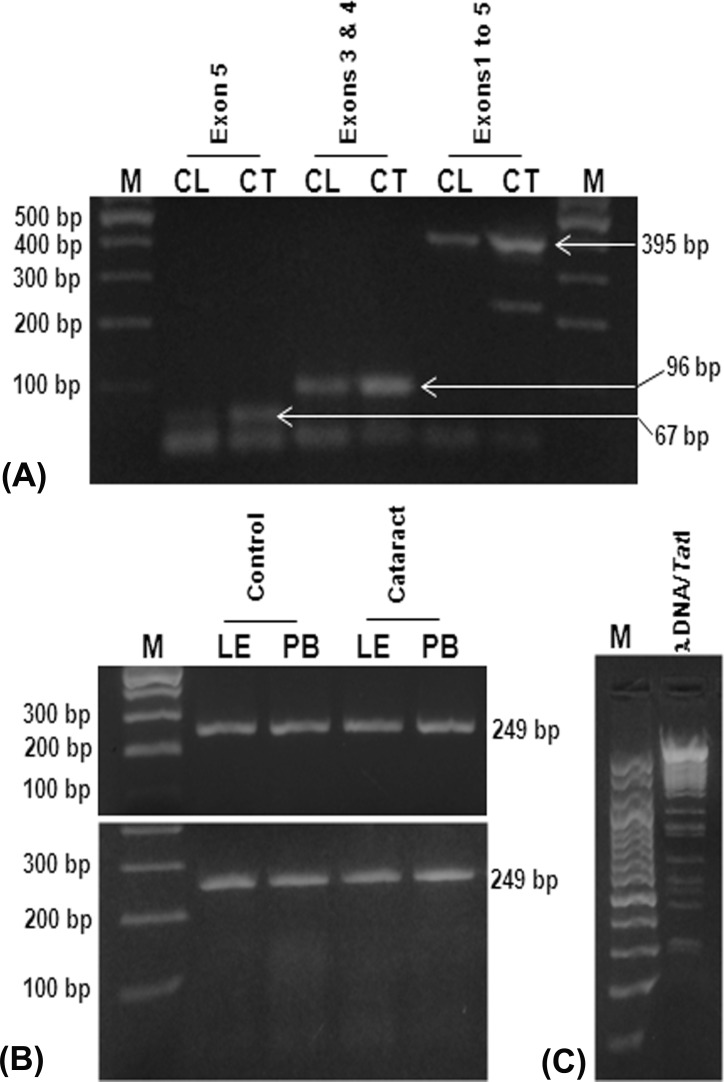
Figure 4.
(A) Real-time PCR analysis of different exonic regions of SOD1 transcripts in clear (CL) and cataract (CT) samples. M, 100 bp DNA ladder; lanes 2 and 3, amplicons corresponding to exon 5 (67 bp) region; lanes 4 and 5, amplicons corresponding to exons 3 and 4 (96 bp) region; lanes 5 and 6, amplicons corresponding to exons 1 to 5 (395 bp) region. (B) Polymerase chain reaction–RFLP analysis of IVS4+42delG polymorphism in DNA isolated from LE and peripheral blood (PB) samples. Neither DNA sample showed expected digestion fragments of 192 and 52 bp upon TatI restriction enzyme (lower panel), which showed intact exon4 fragment of 249 bp similar to undigested exon4 amplicons (upper panel), exon4/TatI restriction enzyme digestion (lower panel). (C) Assessment of functional activity of TatI restriction enzyme. M, 100 bp DNA ladder; lane 2, λ DNA upon digestion with TatI restriction enzyme at 65°C for 2 hours showed respective digestion pattern of the enzyme.

