
Figure 4.
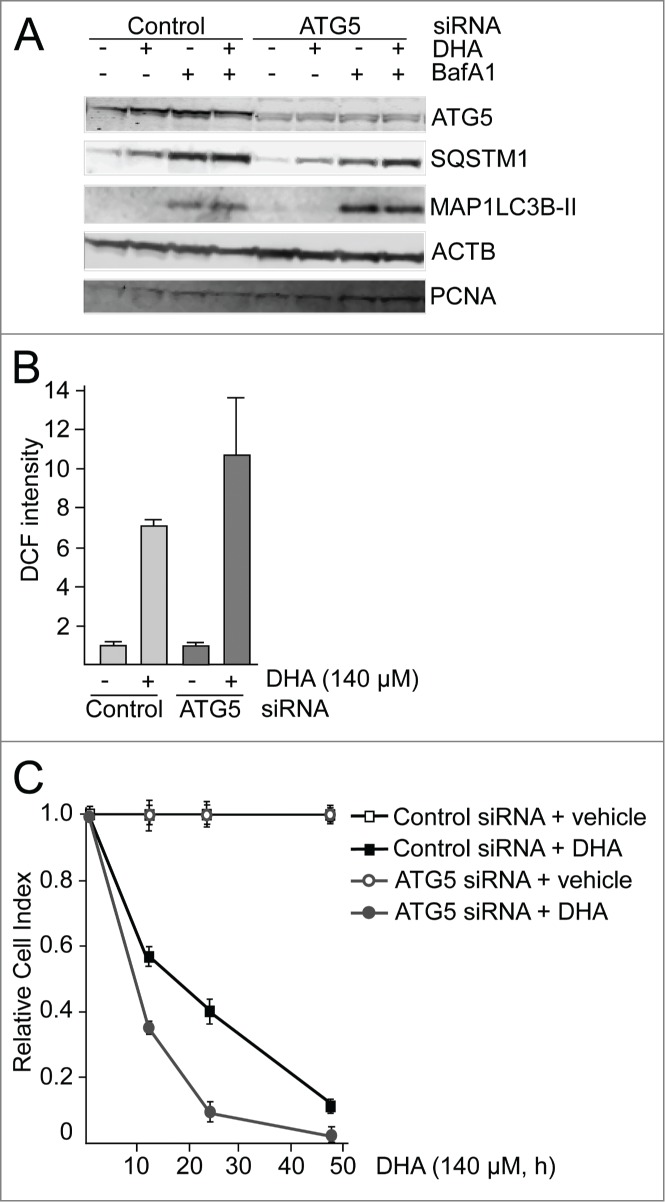
ATG5 is important in the cellular responses to DHA. (A) ARPE-19 cells were transfected with control siRNA or ATG5 siRNA (100 nM) and left for 24 h before reseeding. Following incubation for 24 h, the cells were added DHA (70 μM) or BafA1 (100 nM) for 24 h and immunoblotted for ATG5, SQSTM1, and MAP1LC3B. ACTB and PCNA were used as loading controls. (B) The cells were siRNA-transfected as in (A). After DHA (140 µM) treatment for 3 h changes in ROS levels were measured using a fluorescent ROS DCF probe. The results are representative for 2 independent experiments. Each experiment was performed in duplicates where the mean intensity ±SD of 10,000 cells per well was measured. The control is normalized to one and the relative fold changes are shown. (C) Relative cell index after transfection with control or ATG5 siRNA (100 nM) after vehicle or DHA (140 μM) based on real-time monitoring using the xCELLigence instrument. The cell index for each treatment was normalized to one at the start of the experiment. For each time point the cell index of control samples (Control siRNA + vehicle and ATG5 siRNA + vehicle) was normalized to 1. The effect of DHA treatment after transfection with either Control siRNA or ATG5 siRNA is shown relative to the corresponding controls. Mean normalized cell index with standard deviation of triplicate wells of vehicle or DHA treated cells is displayed. Data shown are representative for 2 independent experiments.