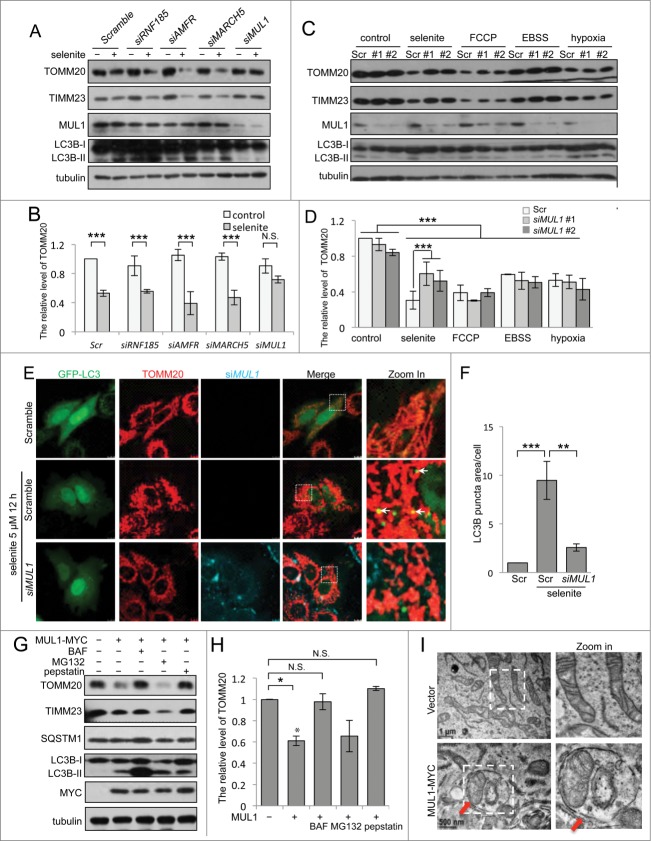
Figure 1.
(See previous page). Identification of MUL1 in selenite-induced mitophagy. (A) HeLa cells transfected with siRNAs specifically targeting RNF185, AMFR, MARCH5 or MUL1 were treated with 5 μM of selenite for 12 h, followed by western blot analysis of the indicated proteins. (B) Quantitative analysis of the TOMM20 protein level described in (A). TOMM20 protein level was determined by dividing the intensity of TOMM20 with the intensity of tubulin on the blot. (The intensity of bands was measured with ImageJ software; mean ±SEM, from 3 independent experiments, 2-way ANOVA, ***P < 0.001, N.S., not significant.) (C) HeLa cells transfected with siMUL1 or scrambled RNA (Scr) were treated with the indicated stresses (5 μM FCCP, 6 h; EBSS, 6 h; hypoxia with 1% O2, 12 h), followed by the analysis of the indicated protein levels. (D) Quantitative analysis of the TOMM20 protein level described in (C). TOMM20 protein level was determined by dividing the intensity of TOMM20 with the intensity of tubulin on the blot (the intensity of bands was measured with ImageJ software; mean ±SEM, from 3 independent experiments, 2-way ANOVA, ***P < 0.001). (E) HeLa cells expressing GFP-LC3 were transfected with scrambled RNA or siMUL1-CY5, followed by treatment with 5 μM of selenite for 12 h and immunofluorescence microscopy to detect GFP-LC3 puncta. (F) Quantification of GFP-LC3 punctate structures associated with the mitochondria (TOMM20) described in (E) (mean ±SEM; n = 50 cells from 3 independent experiments, one-way ANOVA, **P < 0.01, ***P < 0.001). (G) HeLa cells transfected with MUL1-MYC were treated with 5 μM of selenite for 12 h with or without 10 nM BAF, 5 μM MG132 or 10 mg/mL pepstatin for 6 h and subjected to western blotting analysis of the indicated protein levels. (H) Quantitative analysis of the TOMM20 protein level described in (G). TOMM20 protein level was determined by dividing the intensity of TOMM20 with the intensity of tubulin on the blot (The intensity of bands was measured with Image J software. mean ±SEM, from 3 independent experiments, 2-way ANOVA, *P < 0.05, N.S., not significant). (I) HeLa cells were overexpressed with MUL1-MYC for 24 h, and then the samples were analyzed by electron microscopy. Arrows indicate that mitochondria are enclosed within autophagosomes.

