
Fig. 1.
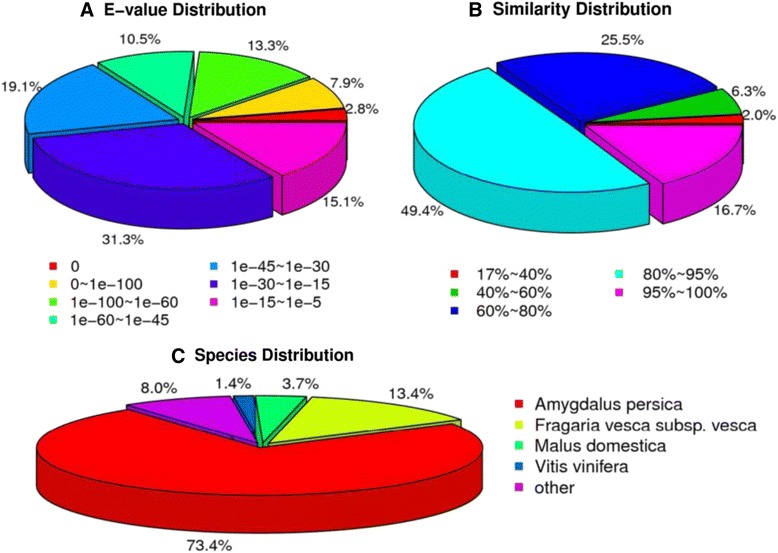
Characteristics of homology search for Illumina sequences against the NR database. a E-value distribution of BLAST hits for matched unique sequences with an E-value cut-off of 1.0E−5. b Similarity distribution of the top BLAST hits for each unique sequence. c Species distribution is shown as the percentage of the total homologous sequences (with an E-value ≤1.0e−5. All plant proteins in the NCBI NR database were used in the homology search and the best hits of the sequences were extracted for analysis