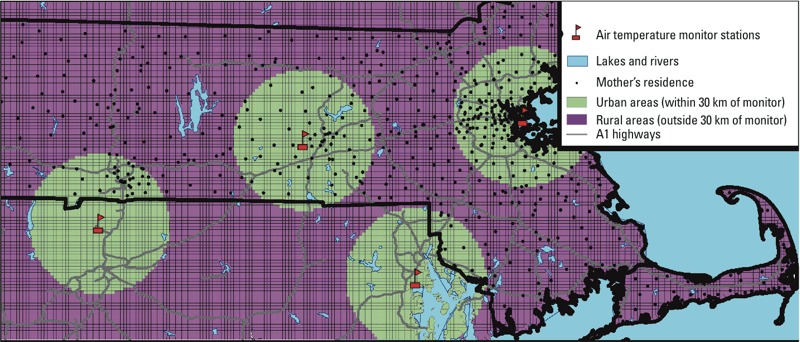
Figure 1.

Map of the study area showing the location of a sample subset of mothers [randomly selected with the QGIS tool “random points” (http://www.qgis.org/)], the location of the ground air monitoring stations, and the areas within and outside 30 km of an air temperature station (urban vs. rural areas).
