Figure 2.

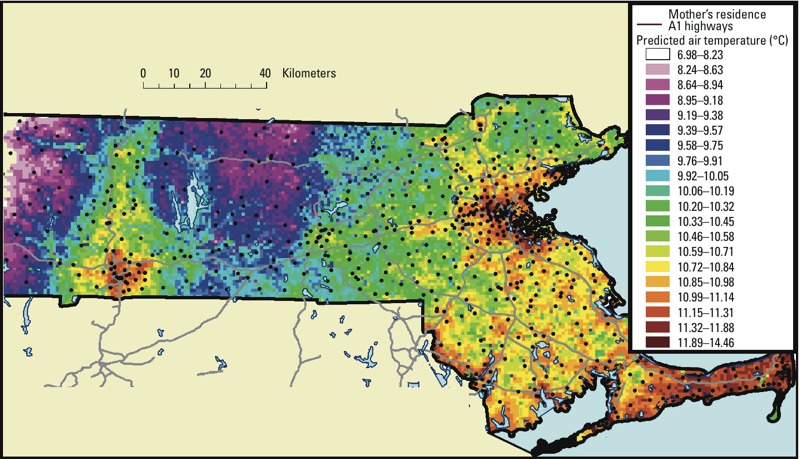
Map of the study area showing the residential location of a subset of mothers over the daily predicted air temperature (°C) 1 × 1 km grid averaged for the entire year of 2005.

Map of the study area showing the residential location of a subset of mothers over the daily predicted air temperature (°C) 1 × 1 km grid averaged for the entire year of 2005.