
Figure 2.
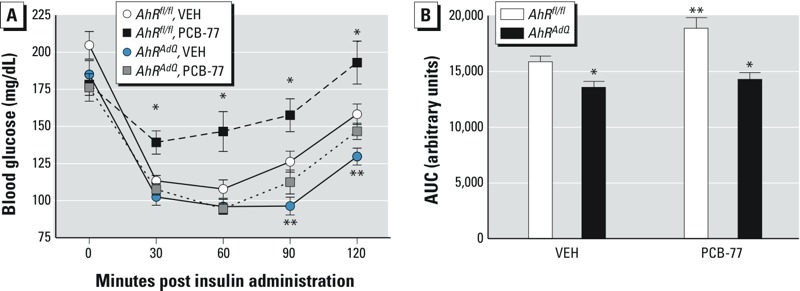
Effect of adipocyte AhR deficiency on insulin tolerance in lean mice administered PCB-77. (A) Blood glucose concentrations following administration of insulin in mice of each genotype administered VEH or PCB-77 (week 3). Data are mean ± SE from n = 6–8 mice/group. *p < 0.05 compared with VEH within genotype. **p < 0.05 compared with AhRfl/fl within treatment. (B) Area under the curve (AUC) for data in (A). Data are mean ± SE from n = 6–8 mice/group. *p < 0.05 compared with AhRfl/fl within treatment. **p < 0.05 compared with VEH within genotype.