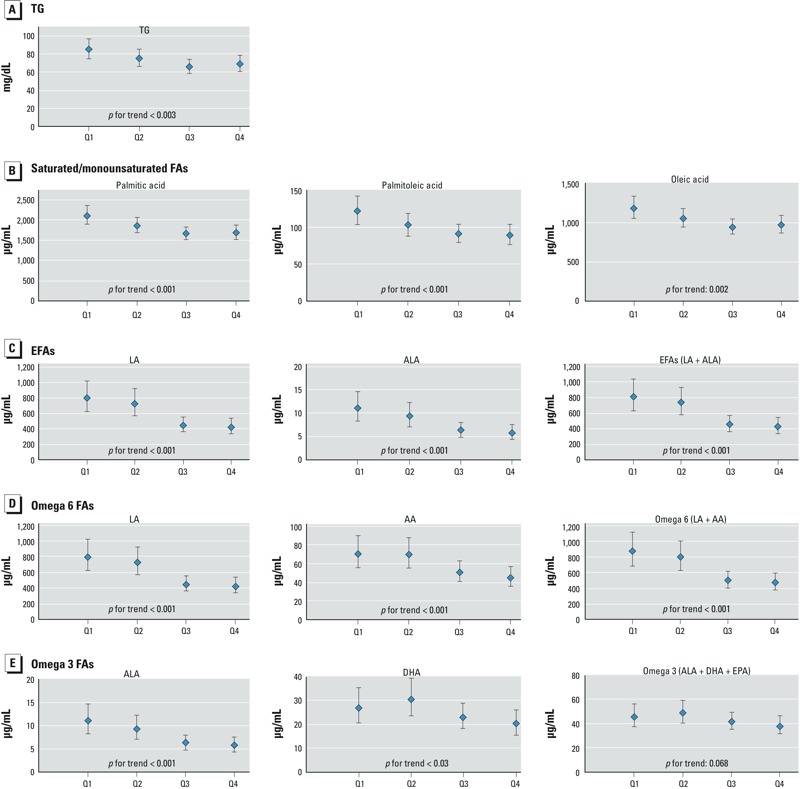
Figure 1.

The dose–response relationship between the quartiles (Q) of PFOS and reduced levels of TG (A) and FAs (B–E) in maternal serum samples, Sapporo, Japan, 2002–2005 (n = 306). The LSMs were adjusted for maternal age, smoking and alcohol intake during pregnancy, annual household income, parity, and the blood sampling period (categorical). For EPA, DHA, and omega 3 FAs, the adjusted model also included fish intake. The LSMs were back transformed from log10 to normal values, and the error bars depict 95% CIs.
