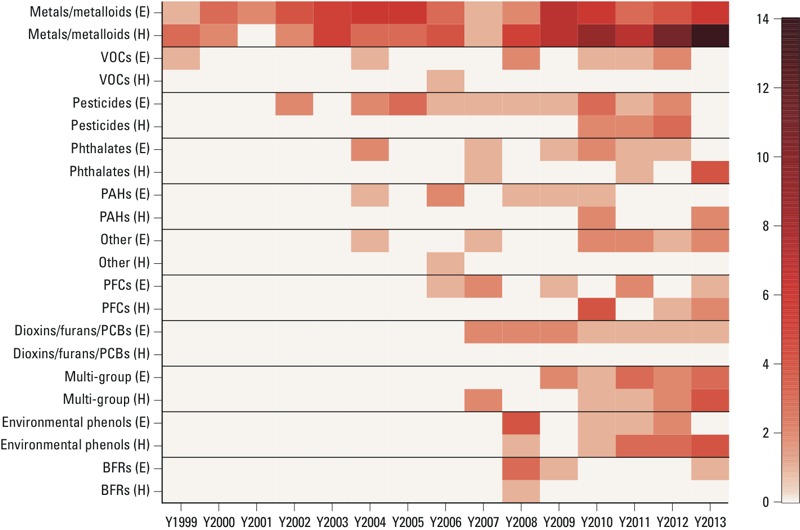
Figure 4.

Yearly chemical biomarker–related publications stratified by chemical group and analysis category. Abbreviations: E, exposure assessment; H, health association. Darker colors reflect a higher number of publications for the specified chemical group in a particular year. The scale indicates the publication count by color.
